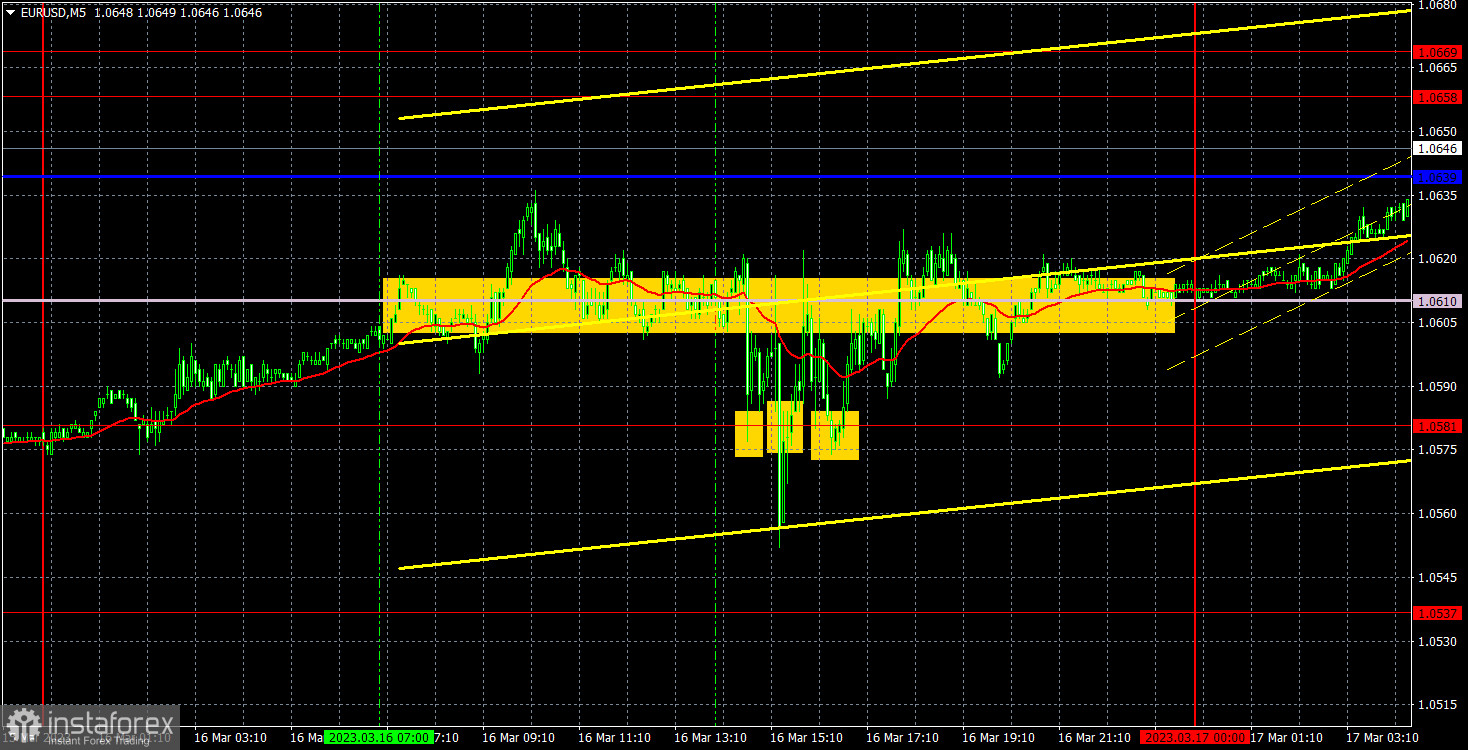
5M chart of EUR/USD
On Thursday, EUR/USD continued to trade in the "swing" mode, and on all charts, not only on the higher ones. Naturally, this kind of movement does not make it possible to earn a lot, but traders couldn't do it, at least in the second part of the day, when it was obvious that we would not wait for normal movements. In the European session, there was exactly one attempt to show a trend movement and one normal buy signal, when the price settled above the Senkou Span B line. The price managed to go only 18 pips in the right direction, but it was enough to buy with a Stop Loss. In general, traders should have noticed right away that there is a 30 pips distance between 1.0581, the critical line and the Senkou Span B. That is, when the signal was formed, the price was almost immediately near the target level, from which there was a risk of rebound. That is why we could only consider the signal when the pair settled below 1.0581, but it was formed during the announcement of the results of the European Central Bank meeting, so you should ignore it.
The results of the meeting was kind of dull. The rate was raised by 0.5%, as forecasted, and ECB President Christine Lagarde did not say anything important or resonant at the press-conference. Thus, there was nothing for traders to react to. It's the same thing with the US data. The reports were not the most important, and were not very different from the forecasted values.
COT report:
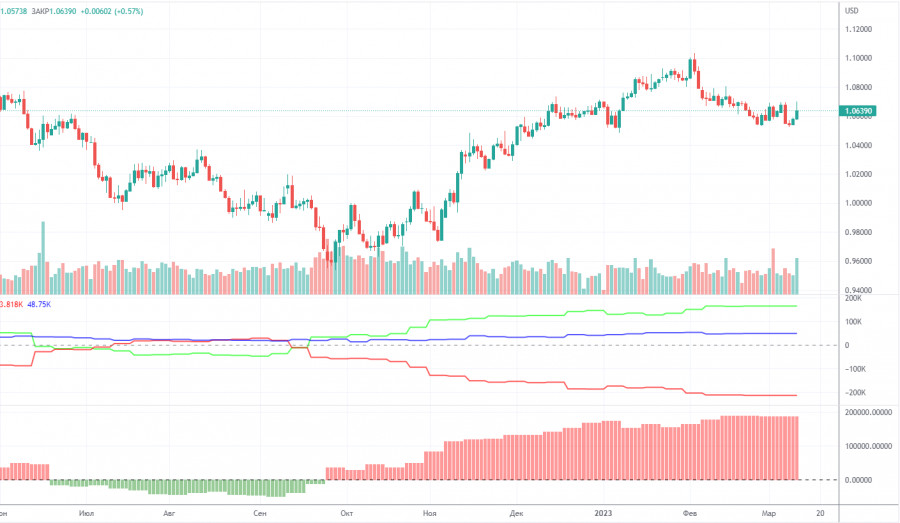
A new COT report came out on Friday... for February 21... That was almost a month ago, while the report of February 14 has disappeared... It seems that the Commodity Futures Trading Commission will now publish reports with a month's delay for some time. In the event of this, the reports will hardly be of great importance. Recall that there was a technical glitch in the CFTC, so the data we receive now is considered irrelevant. So far, we can say that in the last few months, the overall picture has been corresponding to the market situation. On the chart above, we see that the net non-commercial position of large traders (second indicator) has risen since September 2022. At about the same time, the euro started to rise. The net non-commercial position is bullish and continues to increase with each new week, allowing us to expect the uptrend to stop shortly. Such a signal comes from the first indicator, with the green line and the red line being far apart, which is usually a sign of the end of a trend. The euro has already begun its bearish move against the greenback. So far, it remains unclear whether it is just a bearish correction or a new downtrend? According to the latest report, non-commercial traders closed 100 long positions, and 1,300 short ones. Consequently, the net position rose by 1,200. The number of long positions exceeds that of short ones by 165,000. In any case, a correction has been looming for a long time. Therefore, even without reports, it is clear that the downtrend will continue.
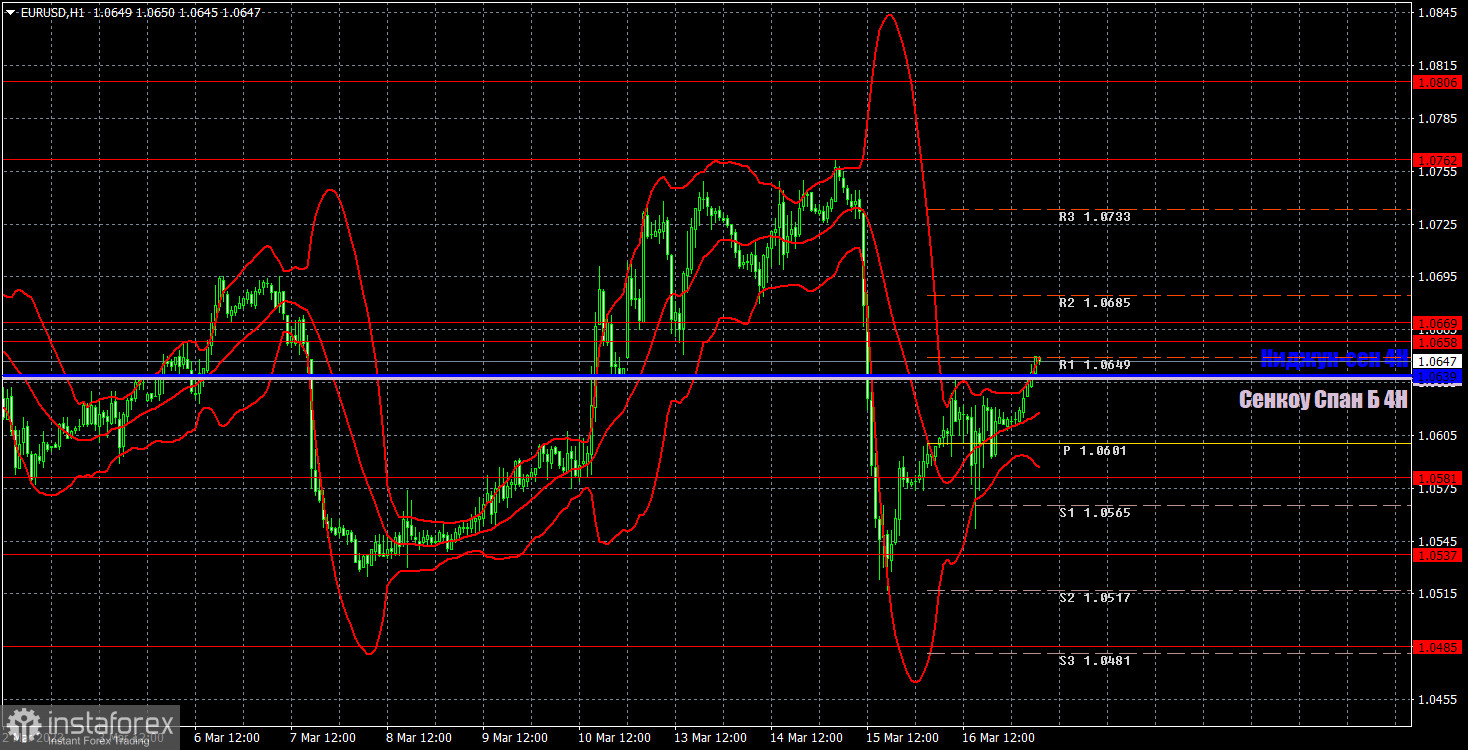
1H chart of EUR/USD
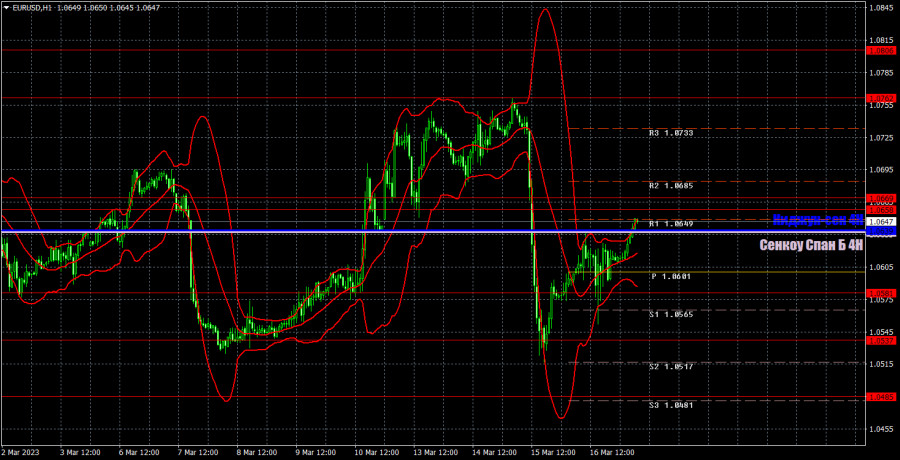
On the one-hour chart, EUR/USD continues to trade in a "swing" mode with all the ensuing consequences. The Kijun-Sen and Senkou-Span B lines have practically merged, which is the best evidence of a flat. Therefore, when opening any positions using any signals, we should consider not only the flat, but also the swing. On Friday, important levels are seen at 1.0340-1.0366, 1.0485, 1.0537, 1.0581, 1.0658-1.0669, 1.0762, 1.0806, 1.0868, and also Senkou Span B (1.0637) and Kijun Sen (1.0639). Ichimoku indicator lines can move intraday, which should be taken into account when determining trading signals. There are also support and resistance although no signals are made near these levels. They could be made when the price either breaks or rebounds from these extreme levels. Do not forget to place Stop Loss at the breakeven point when the price goes by 15 pips in the right direction. In case of a false breakout, it could save you from possible losses. On March 17, the most important report of the week will be the inflation report. The reaction to it will be just like yesterday's ECB meeting. In the US, we will just receive minor reports, which is unlikely to provoke a strong reaction.
Indicators on charts:
Resistance/support - thick red lines, near which the trend may stop. They do not make trading signals.
Kijun-sen and Senkou Span B are the Ichimoku indicator lines moved to the hourly timeframe from the 4-hour timeframe. They are also strong lines.
Extreme levels are thin red lines, from which the price used to bounce earlier. They can produce trading signals.
Yellow lines are trend lines, trend channels, and any other technical patterns.
Indicator 1 on the COT chart is the size of the net position of each trader category.
Indicator 2 on the COT chart is the size of the net position for the Non-commercial group of traders.