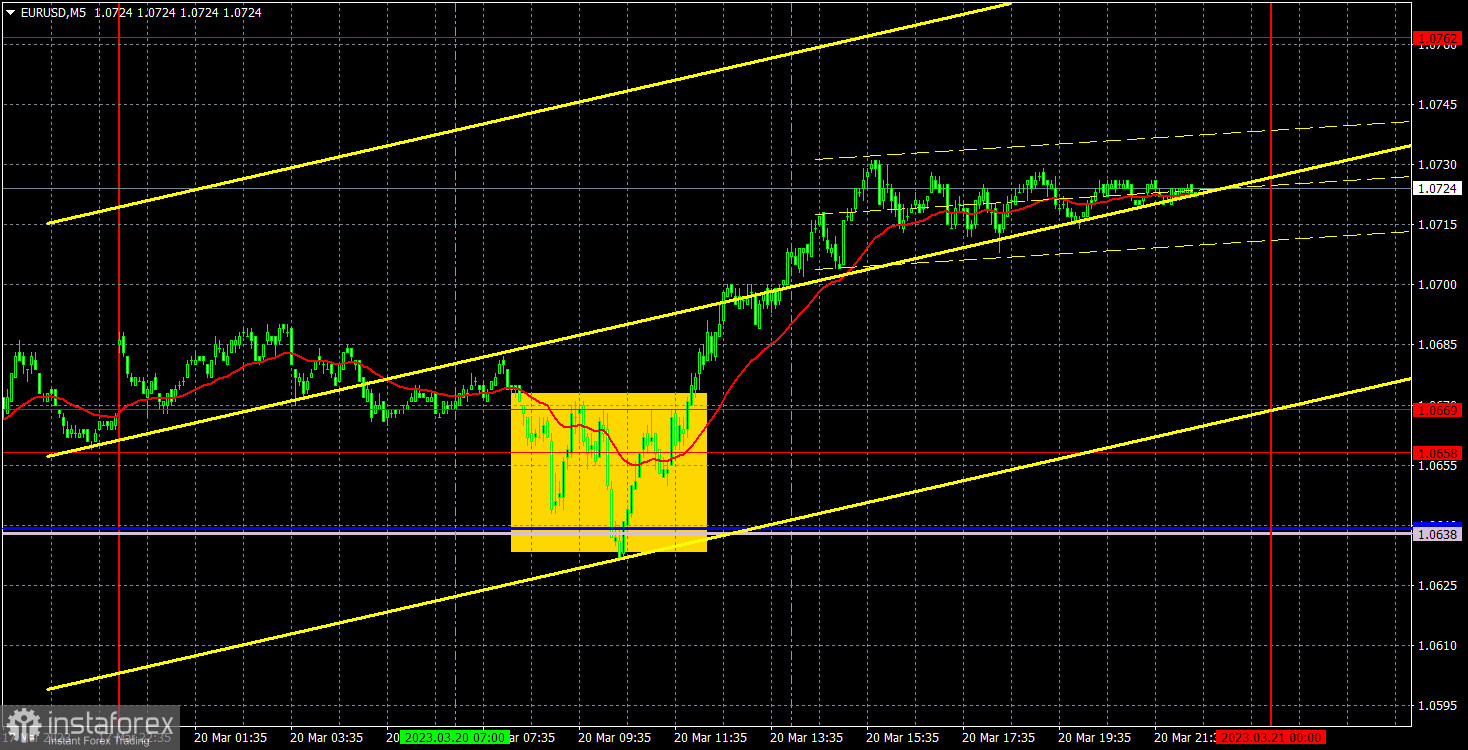
5M chart of EUR/USD
On Monday, EUR/USD showed growth again. There were formal grounds for this. There's news about the merger of Swiss banks UBS and Credit Suisse, which in fact means the bailout of the latter, and also, European Central Bank President Christine Lagarde delivered a speech in the European Parliament. Maybe the news of the banks' merger really did support the euro since Lagarde didn't say anything amazing. On the contrary, her rhetoric was actually full of dovish hints. However, traders found reasons to buy the euro on Monday. If the euro continues to rally today (and take note that the economic calendar is empty), we'll be sure that it's not about "fundamentals" or macroeconomics. It's just that the pair keeps on swinging.
There was only one trading signal on Monday. The pair rebounded from the 1.0638-1.0669 area, within which there were two levels and two Ichimoku indicator lines. Therefore, all these levels and lines should be considered as an area. By the way, you shouldn't brush off the possibility that the pair might have grown due to technical reasons, namely this bounce. As a result, the pair managed to go up about 45-50 pips after the signal was formed, and that is how much traders could earn on the long position. In any case, it should have been closed manually, because the pair did not reach the nearest target level at the end of the day.
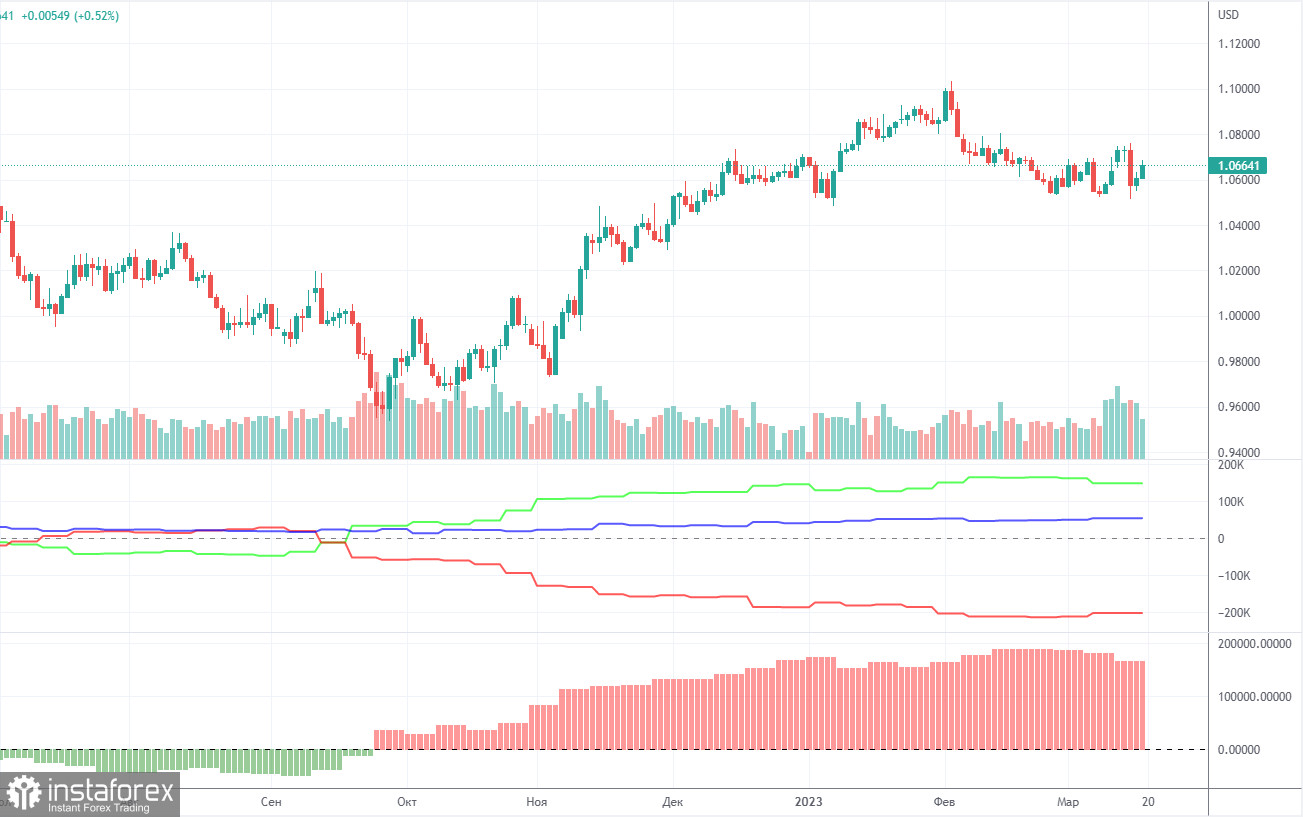
COT report:
On Friday, the new COT report for March 7 was released. The Commodity Futures Trading Commission is slowly catching up with the lost time and publishes reports that have a frequency of two weeks. At this rate, in a couple of weeks we will get the actual data again. So far, we can say that in the last few months, the overall picture has been corresponding to the market situation. On the chart above, we see that the net non-commercial position of large traders (second indicator) has risen since September 2022. At about the same time, the euro started to rise. The net non-commercial position is bullish and only started to fall during the last couple of weeks, which coincides with the euro's decline. I have already drawn your attention to the fact that a fairly high value of the "net position" allows us to expect the uptrend to stop shortly. Such a signal comes from the first indicator, with the green line and the red line being far apart, which is usually a sign of the end of a trend. The euro has already started to fall, but we don't know if it's just a bearish correction or a new downtrend. According to the latest report, non-commercial traders closed 6,900 long positions, while the number of short ones increased by 6,900. Consequently, the net position fell by 13,800. The number of long positions exceeds that of short ones by 148,000. In any case, a correction has been looming for a long time. Therefore, even without reports, it is clear that the downtrend will continue.
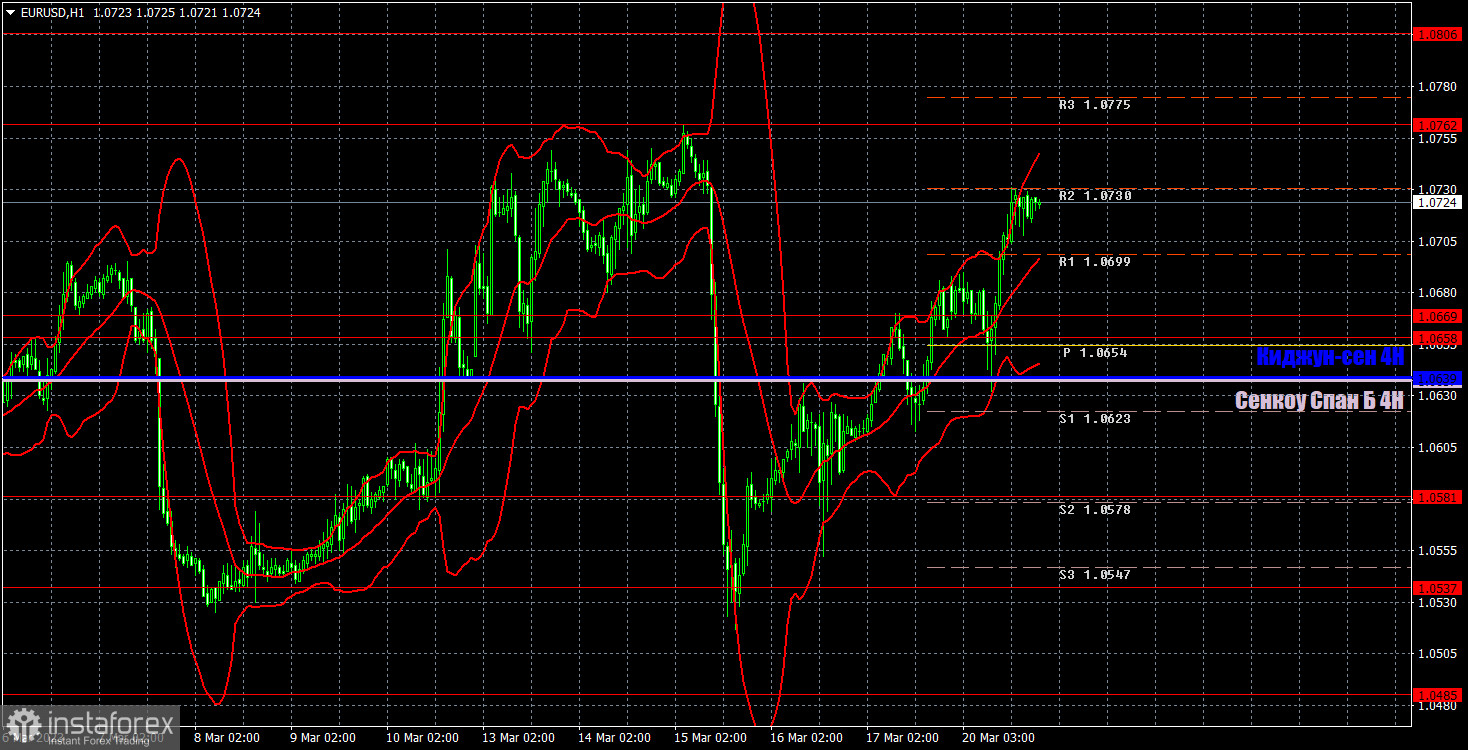
1H chart of EUR/USD
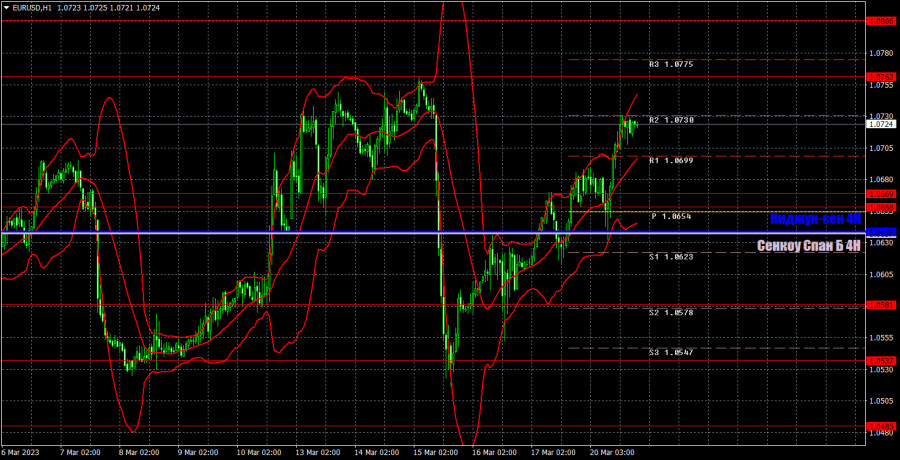
On the one-hour chart, EUR/USD continues to trade in a "swing" mode and at the moment, it is approaching 1.0762, where the last growth spiral ended. The Kijun-Sen and the Senkou-Span B lines have merged, which is the best evidence of a flat. Therefore, when opening any positions using any signals, don't forget that you might encounter either a flat or swing. A pullback from 1.0762 may easily cause a new decline of 230-250 pips. On Tuesday, important levels are seen at 1.0340-1.0366, 1.0485, 1.0537, 1.0581, 1.0658-1.0669, 1.0762, 1.0806, 1.0868, 1.0938, as well as the Senkou Span B (1.0637) and Kijun Sen (1.0639) lines. Ichimoku indicator lines can move intraday, which should be taken into account when determining trading signals. There are also support and resistance although no signals are made near these levels. They could be made when the price either breaks or rebounds from these extreme levels. Do not forget to place Stop Loss at the breakeven point when the price goes by 15 pips in the right direction. In case of a false breakout, it could save you from possible losses. On March 21, Lagarde will give another speech in the European Union, which is unlikely to differ from yesterday's. In the U.S., the calendar of events is completely empty. Traders will have nothing to react to, so the movement will be purely technical again.
Indicators on charts:
Resistance/support - thick red lines, near which the trend may stop. They do not make trading signals.
Kijun-sen and Senkou Span B are the Ichimoku indicator lines moved to the hourly timeframe from the 4-hour timeframe. They are also strong lines.
Extreme levels are thin red lines, from which the price used to bounce earlier. They can produce trading signals.
Yellow lines are trend lines, trend channels, and any other technical patterns.
Indicator 1 on the COT chart is the size of the net position of each trader category.
Indicator 2 on the COT chart is the size of the net position for the Non-commercial group of traders.