A slowdown within the variable level of 1.0850 occurred during the recovery process. The corrective movement from the support level of 1.0775 did to update the local high for the second time, but focused instead on the variable level of 1.0850. In fact, we got a kind of accumulation within it, where the amplitude is just over 40 points.
If we focus on recovery and accumulation, a clear sell signal arises, which means that there is a chance to update the lows.
Regarding further development, the last review revealed signs of a downward trend. To confirm that judgment, traders do not only need to go below 1.0775, but sellers need to update the lows of 1.0636. Otherwise, a slowdown may occur, which will take the form of a wide flat, and will drag on for a very long time.
Analyzing the past trading day, we see that the most remarkable jump in prices occurred at the start of the European session. The quote went down to the area of 1.0830, but quickly reversed upwards. All subsequent fluctuations had variable boundaries of 1.0850 / 1.0885, which embodied the accumulation.
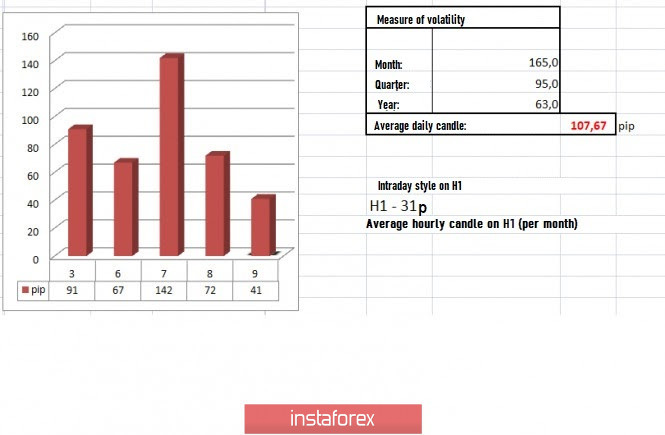
In terms of volatility, there's a slowdown in activity, where the daily dynamics was 72 points, or 32% less than the average. This is not surprising as the market is just adapting to the external background, and the dynamics of the pair will still return to the standards of 50-80 points [average daily activity, with the usual external background].
Details of volatility: Monday - 155 points; Tuesday - 183 points; Wednesday - 115 points; Thursday - 278 points; Friday - 166 points; Monday - 151 points; Tuesday - 234 points; Wednesday - 243 points; Thursday - 326 points; Friday - 194 points; Monday - 191 points; Tuesday - 160 points; Wednesday - 133 points; Thursday - 188 points; Friday - 194 points; Monday - 134 points; Tuesday - 127 points; Wednesday - 136 points; Thursday - 147 points; Friday - 91 points; Monday - 67 points; Tuesday - 142 points; Wednesday - 72 points.
The average daily indicator, relative to the dynamics of volatility, is 107 points [see table of volatility at the end of the article].
As discussed in the previous review, traders saw the accumulation process and waited for possible bursts of activity. However, the key coordinates of 1.0830 / 1.0890 were not affected.
Considering the trading chart in general terms [the daily period], we see that the quote is still in the structure of the downward movement of March 30, where the existing fluctuation did not change the structure.
The news background yesterday did not contain any noteworthy statistics on Europe and US, except the Fed's minutes of the meeting.
Yesterday, the minutes of the Fed's last two emergency meetings, which took place on March 2 and 15, were published. Recall that during the first meeting, the interest rate was reduced by 0.50% to 1.00-1.25%. At the second meeting, the rate was reduced by 100 basis points, to the level of 0.00-0.25%.
According to the minutes, the regulator followed the threats of a sharp decline in economic activity, as well as the worsening market conditions in the United States caused by the COVID-19 virus.
"The timing of the resumption of growth of the US economy will depend on the measures to curb the spread of coronavirus, as well as on the success of these measures and other responses, including fiscal policy," the protocol says.
Charles Evans, head of the Federal Reserve Bank of Chicago, believes that employment and production in US will plummet this quarter, but the economy will begin to recover in the second half of the year.
Regarding the COVID-19 virus, the total number of confirmed coronavirus cases across the world has already passed 1.5 million.
The data on the applications for unemployment benefits in the United States has exceeded its forecasts twice. The current indicators are not an exception. But, although the results of the index may again not coincide with forecasts, market participants understand that the consequences of the COVID-19 virus will affect not only US, but also other countries where the indicators are probably not better, so investors continue to hold a protective asset - the dollar.
Regarding applications, the forecasts are as follows: Initial applications - 5,150,000; Repeated applications - 6,990,000.
Further development
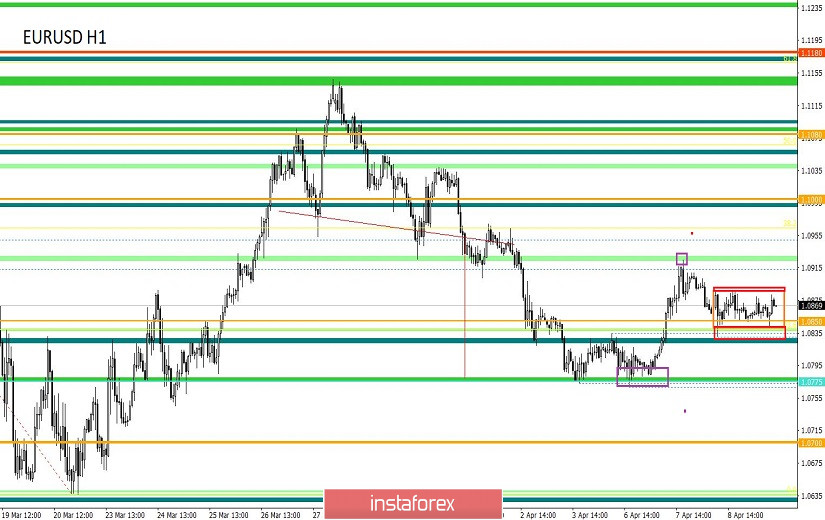
Analyzing the current trading chart, we see that the quote has been fluctuating within 1.0850 / 1.0885 for more than 25 hours. There were attempts to break through the lower frame, but relative to the hourly period, this is just punctures by shadows. The accumulation process remains on the market, which means that the acceleration of activity is just around the corner.
The fluctuation in the range of 1.0850 / 1.0885 may not last very long. Many hope that the downward movement will resume. The main strategy now is really a downward development, so we should work on the existing accumulation, where if the breakdown of borders occur, we will open local positions in the market.
Based on the above information, we have the following trading recommendations:
- Consider sell positions if the price consolidates below 1.0825, with the prospect of moving to 1.0775. The main movement will happen after the price consolidates below 1.0775.
- Consider buy positions if the price consolidates above 1.0890, with the prospect of moving to 1.0925. Further movement will happen after the price consolidates above 1.0930, with the prospect of 1.0960–1.1000.
Indicator analysis
Analyzing the different sector of timeframes (TF), we see that due to the corrective movement, as well as the current accumulation, the indicators on the daily and hourly periods give a variable buy signal. Daytime periods, on the other hand, work on the direction of the main movement, where a sell signal is present.
Volatility per week / Measurement of volatility: Month; Quarter; Year
The measurement of volatility reflects the average daily fluctuation calculated for Month / Quarter / Year.
(April 9 was built taking into account the time of publication of the article)
The current volatility is 41 points, which is 61% lower than the daily average. As soon as the accumulation framework is broken, volatility will at least double.
Key level
Resistance zones: 1,1000 ***; 1.1080 **; 1,1180; 1.1300; 1.1440; 1.1550; 1.1650 *; 1.1720 **; 1.1850 **; 1,2100
Support zones: 1,0850 **; 1.0775 *; 1.0650 (1.0636); 1,0500 ***; 1.0350 **; 1,0000 ***.
* Periodic level
* * Range level
*** Psychological level