The EUR/USD currency pair managed to break out of the trap, breaking the level of 1.1910 and focusing within 1.1920 / 1.1965, after a monthly fluctuation within the boundaries of the side channel 1.1700 // 1.1800 // 1.1910. The upward move set in mid-may was resumed on the occasion of a flat break, which means that the medium-term upward trend is still relevant in the market.
The situation in numbers:
- 94 days have passed since the beginning of the medium-term upward trend.
- For 94 days, there were two upward inertia.
- The total distance covered is 1165 points.
- The overall recovery from the medium-term downtrend from 2018 is 70%.
Based on the obtained values, it can be seen that the rate of price change during the construction period of the medium-term upward trendhas a huge level of overbought in relation to the European currency. The design is so unstable and saturated with speculation that it is difficult to believe that the upward move continues in the market. The fault lies with the US dollar, which is losing positions against almost all currencies, being in the stage of a total sell-off.
In this situation, the moment of understanding the oversold dollar is interesting, where there will be an understanding sooner or later that the vertical move can no longer hold the balance.
Analyzing the last trading day every minute, you can see another round of long positions, where the highest speculative interest fell on the start of the European session, breaking through the upper flat line 1.1910 -> 1.1965.
In terms of daily dynamics, the first acceleration in four days is recorded, the volatility of 100 points, which is 17% higher than the average level for the dynamics of the EUR/USD. The acceleration is due to speculation, coupled with a breakdown of the flat border.
As discussed in the previous review , traders had been preparing for a breakout of one or another flat boundary for as long as a week, positions on a local impulse brought income to almost everyone, who were watching the market.
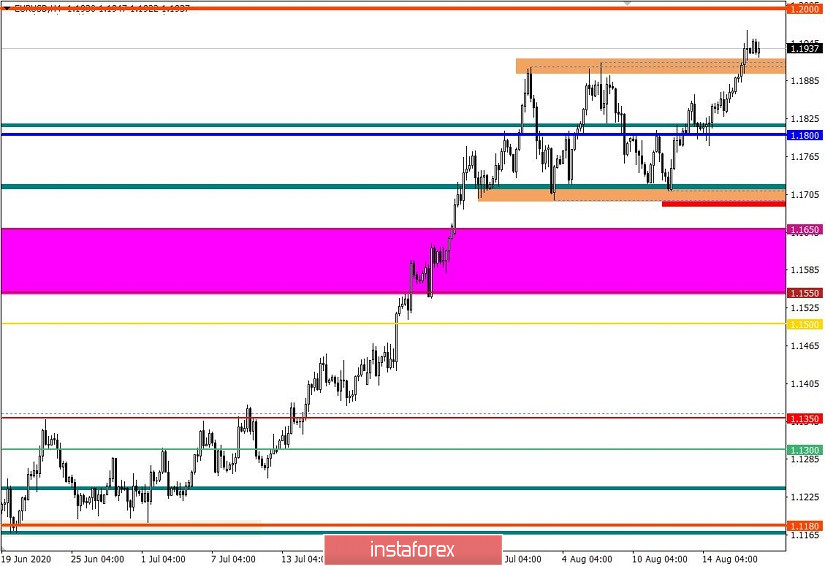
Considering the trading chart in general terms (daily period), it can be seen that the breakdown of the flat led to the renewal of the current year high and the price focusing at the levels of the spring of 2018.
The news background of the past day had data on construction in the United States, where the number of new homes in July increased by 22.6% compared to the revised figure in June and amounted to 1,496,000. At the same time, the number of building permits in the United States in July rose by 18.8%, to 1,495,000. Growth is on all fronts, but this did not help the US dollar, since the market literally ignored the positive statistics.
In terms of information background, we have a call from former ECB head, Mario Dragh,i to optimize the financial structure of the European Union. So during the event in Rimini, Draghi called on EU governments to direct debit resources to creative purposes.
The former head of the ECB said that the European Union can fully recover from the economic consequences caused by the coronavirus only if the EU leaders send large amounts of funds raised in the debt market to invest in youth, innovation and research.
Draghi also called for the creation of a common Ministry of Finance in the European Union, which will ensure the stabilization of the economy.
Today, in terms of the economic calendar, we expect data on inflation in the European Union, where inflation is predicted to rise from 0.3% to 0.4%, which may support the European currency. In the evening, we are expected to publish the minutes of the last meeting of the Federal Reserve System, which may give some idea of how the regulator sees the course of the country's economic recovery.
Further development
Analyzing the current trading chart, you can see the amplitude fluctuation of the price within the values of 1.1920/1.1965, where consolidation above the flat has already been confirmed in the market. In this situation, we can consider a further upward move, but only if the quote is consolidated above the high of the previous day - 1.1965, which will give more confidence to buyers.
At the same time, the situation with a slowdown within 1.1920/1.1965 allows traders to be on the wave of speculation, working on the breakout of the set boundaries.
Local operations relative to easing frames:
- Consider buy deals above 1.1965, with the prospect of a move to the area of the psychological level of 1.2000
- Consider sell deals below 1.1920, towards 1.1890.
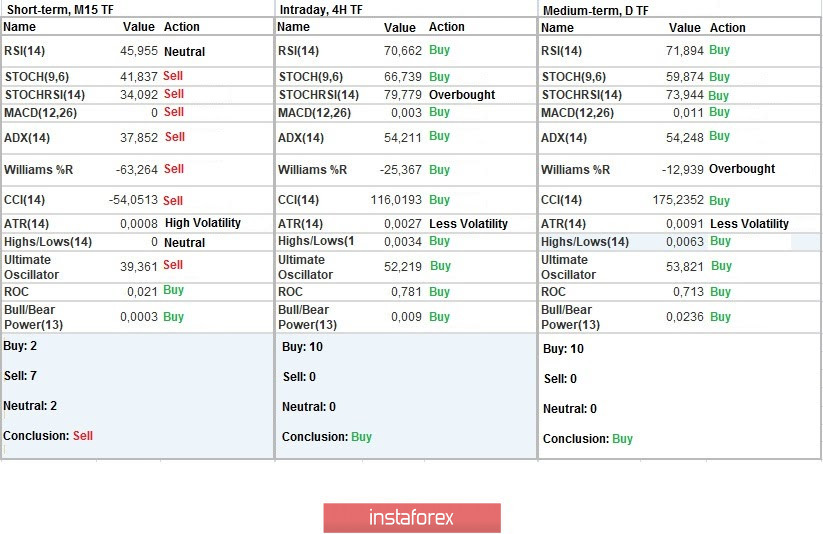
Indicator analysis
Analyzing different sectors of time frames (TF), we see that the indicators of technical instruments on minute intervals have a variable signal due to the current amplitude of 1.1920/1.1965. Meanwhile, hourly and daily periods signal buying by updating the maximum and breaking the flat.
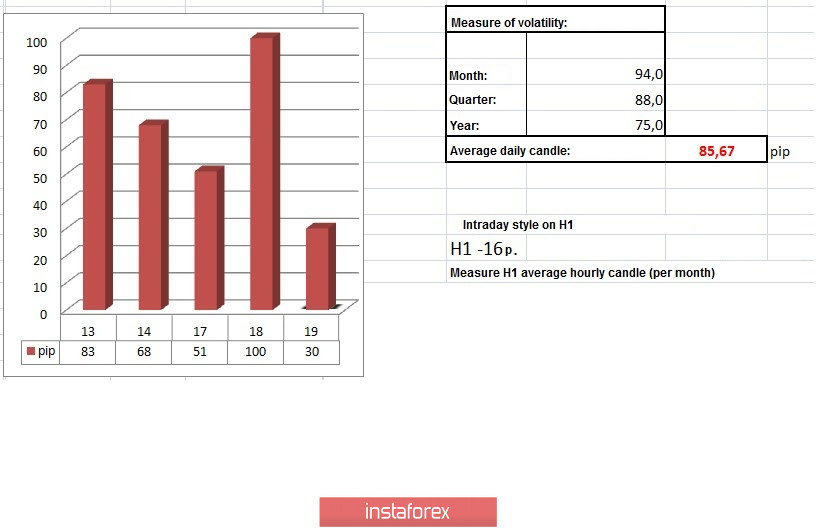
Weekly volatility / Volatility measurement: Month; Quarter; Year
The volatility measurement reflects the average daily fluctuations, calculated per Month / Quarter / Year.
(August 19 was built taking into account the time of publication of the article)
The volatility of the current time is 30 points, which is 64% lower than the daily average. The current dynamics reflect price fluctuations within the framework of stagnation, but as soon as the boundaries are broken, activity will arise.
Key levels
Resistance zones: 1.2000 ***; 1.2100 *; 1.2450 **; 1.2550; 1.2825.
Support zones: 1.1910 **; 1.1800; 1.1650 *; 1.1500; 1.1350; 1.1250 *; 1.1180 **; 1.1080; 1.1000 ***; 1.0850 **; 1.0775 *; 1.0650 (1.0636); 1.0500 ***; 1.0350 **; 1.0000 ***.
* Periodic level
** Range level
*** Psychological level