empty
 
 
08.12.2022 06:26 AM
Trading Signal for GOLD (XAU/USD) on December 08-09, 2022: buy above $1,775-1,781 (+1/8 Murray - uptrend channel)

This image is no longer relevant

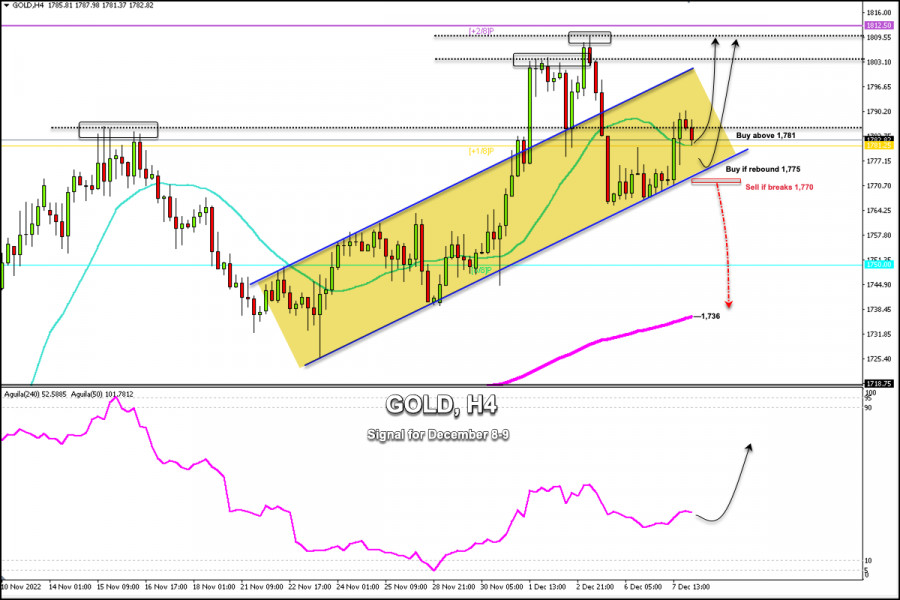
XAU/USD is trading around 1,782, above the 21 SMA showing a bullish bias. It is likely that if gold consolidates above this area, it could reach the zone of 1,803 and even reach +2/8 Murray located in 1,812.

Investors are worried as Vladimir Putin said the threat of nuclear war is growing, suggesting they would use nuclear weapons in response to an attack on his country. This news could increase risk aversion and investors could take refuge in gold. hence, the price could reach levels of 1,850, even quickly climbing as high as the landmark level of 1,900.

Risk aversion could increase, causing investors to be very cautious. This is due to negative data from China, raising concerns about a global recession. This assures investors to take refuge in gold and the price could increase only if it consolidates above the psychological level of 1,800 -1,812.

Yesterday in the American session, gold quickly rose above the uptrend channel, breaking the 21 SMA (1,780) and reaching the swing high of 1,788.06.

The asset is currently consolidating above the key level of 1,781 (21 SMA), suggesting that if it settles above this area, the price could resume the bullish cycle in the next few hours.

In the next few hours, we expect XAU/USD to trade above 1,781 and reach the resistance of 1,803 and even the high of Dec 5 at 1,810. On the other hand, in case of a technical bounce around the uptrend channel formed since November 22, we will have an opportunity to buy around 1,775.

A close on the 4-hour chart below 1,770 and a sharp break of the uptrend channel are critical to trigger further declines in gold. The metal could quickly reach the 8/8 Murray (1,750) and even the 200 EMA located at 1,736.

Our trading plan for the next few hours is to buy gold above 1,781 or in case of a technical bounce around 1,775, with targets at 1,803 and 1,812.

Dimitrios Zappas,
Chuyên gia phân tích của InstaForex
© 2007-2023
EURUSD
Euro vs US Dollar
Select timeframe
5
min
15
min
30
min
1
hour
4
hours
1
day
1
week
Start trade
Start trade
  • Grand Choice
    Contest by
    InstaForex
    InstaForex always strives to help you
    fulfill your biggest dreams.
    THAM GIA CUỘC THI
  • Tiền gửi lần truy cập
    Ký quỹ tài khoản của bạn với $3000 và nhận được $8000 nhiều hơn!
    Trong Tháng 3 chúng tôi xổ $8000 trong chiến dịch Chancy Deposit!
    Có được một cơ hội giành chiến thắng bằng việc ký quỹ $3000 vào một tài khoản giao dịch. Đáp ứng được điều kiện này, bạn trở thành một người tham gia chiến dịch.
    THAM GIA CUỘC THI
  • Giao dịch khôn ngoan, thành công
    Nạp tiền vào tài khoản của bạn với ít nhất $ 500, đăng ký cuộc thi và có cơ hội giành được các thiết bị di động.
    THAM GIA CUỘC THI
  • 100% tiền thưởng
    Cơ hội duy nhất của bạn để nhận 100% tiền thưởng khi gửi tiền
    NHẬN THƯỞNG
  • 55% Tiền thưởng
    Đăng ký tiền thưởng 55% cho mỗi lần gửi tiền của bạn
    NHẬN THƯỞNG
  • 30% tiền thưởng
    Nhận 30% tiền thưởng mỗi khi bạn nạp tiền vào tài khoản của mình
    NHẬN THƯỞNG

Recommended Stories

Forex forecast 03/31/2023 EUR/USD, GBP/USD, GBP/JPY, Oil and Bitcoin from Sebastian Seliga

Let's take a look at the technical picture of EUR/USD, GBP/USD, GBP/JPY, Oil and Bitcoin

Sebastian Seliga 11:04 2023-03-31 UTC+2

Forecast for GBP/USD on March 31, 2023

The GBP/USD pair secured above the level of 1.2342 on Thursday, and the hourly chart shows that development is continuing toward the level of 1.2432. Let me tell you that

Samir Klishi 11:02 2023-03-31 UTC+2

GBP/USD: upside seems over

The GBP/USD pair is trading in the red at the time of writing and it seems very heavy, so more declines are in cards. After its amazing growth, a sell-off

Ralph Shedler 10:20 2023-03-31 UTC+2

Indicator analysis: Daily review of GBP/USD on March 31, 2023

The pound-dollar pair may move down from the level of 1.2382 (closing of yesterday's daily candle) to 1.2352, the 85.4% pullback level (blue dotted line). Upon reaching this level

Stefan Doll 09:55 2023-03-31 UTC+2

Video market update for March 31, 2023

Potential for the downside movement on Silver and BTCUSD

Petar Jacimovic 09:51 2023-03-31 UTC+2

Indicator analysis: Daily review of EUR/USD on March 31, 2023

The euro-dollar pair may move down from the level of 1.0904 (closing of yesterday's daily candle) to 1.0869, the 14.6% pullback level (yellow dotted line). When testing this level

Stefan Doll 09:45 2023-03-31 UTC+2

Technical Analysis of GBP/USD for March 31, 2023

Technical Market Outlook: The GBP/USD pair has made another higher high at the level of 1.2422 as the up trend continues. Nevertheless, on the H4 time frame chart the rally

Sebastian Seliga 08:30 2023-03-31 UTC+2

Technical Analysis of EUR/USD for March 31, 2023

Technical Market Outlook: The EUR/USD bulls finally broke above the intraday technical resistance seen at 1.0868 and are approaching the last swing high located at 1.0930. In a case

Sebastian Seliga 08:29 2023-03-31 UTC+2

USD/JPY in buyers's territory

The USD/JPY pair rallied in the short term registering a new high of 133.50. Now, it has retreated a little to retest the near-term support levels before jumping higher again

Ralph Shedler 08:19 2023-03-31 UTC+2

EURUSD, H4 | Potential Reversal from a key level?

The EUR/USD chart is displaying bearish momentum, indicating a potential drop from the multi-swing high resistance level at 1.0927, coinciding with a 78.60% Fibonacci retracement. The first support level

Dean Leo 08:14 2023-03-31 UTC+2
Không thể nói chuyện ngay bây giờ?
Đặt câu hỏi của bạn trong phần trò chuyện.