empty
 
 
08.12.2022 11:56 AM
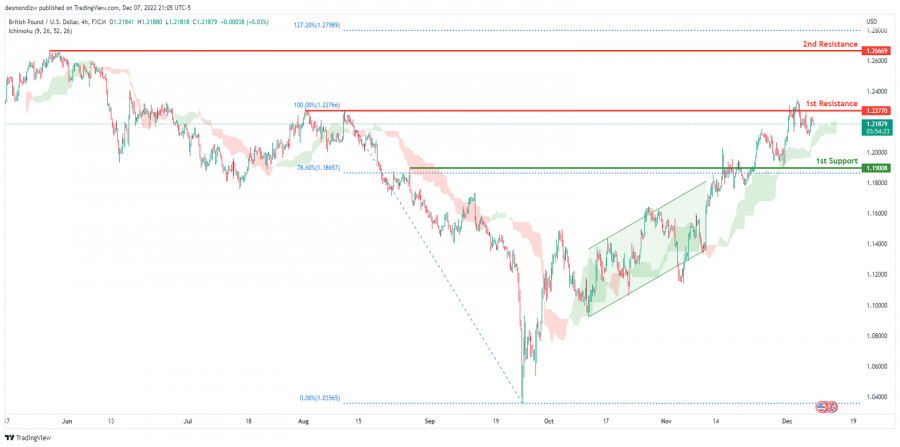
GBPUSD Potential for Bearish Drop | 8th December 2022

This image is no longer relevant
Looking at the H4 chart, my overall bias for GBPUSD is bullish due to the current price being above the Ichimoku cloud, indicating a bullish market. Expecting price to head back up to retest the 1st resistance line at 1.22770, where the previous high is. In an alternative scenario, price could possibly head back down towards the 1st support at 1.19008, where the 78.6% Fibonacci line is.

Trading Recommendation

Entry: 1.22770

Reason for Entry:

1st resistance line

Take Profit: 1.19008

Reason for Take Profit:1st support line

Stop Loss: 1.26669

Reason for Stop Loss:

2nd resistance line

GBPUSD
Great Britain Pound vs US Dollar
Select timeframe
5
min
15
min
30
min
1
hour
4
hours
1
day
1
week
Start trade
Start trade
GBPUSD, H4 | Potential Bearish Reversal from key resistance?
The momentum of the GBP/USD chart is bearish, indicating a possible drop from the 1st resistance level towards the 1st support level. The 1st support level at 1.2194 is a pullback support level that also coincides with a 23.60% Fibonacci retracement, while the 2nd support level at 1.2045 is also a.
Author: Dean Leo
02:55 2023-03-21 UTC--4
1195
USDJPY | PBullish Reversal?
Bullish momentum is currently observed on the USD/JPY chart, with the potential for price to rebound from the 1st support level and make its way towards the 1st resistance level. The 1st support level, situated at 130.8200, is a robust overlap support level with a 78.60% Fibonacci retracement level.
Author: Dean Leo
02:54 2023-03-21 UTC--4
1330
AUDUSD, H4 | Break out trendline?
Currently, the AUD/USD chart reflects bullish momentum, indicated by the break above a descending resistance line and the crossing above the Ichimoku cloud. The potential for continued bullish movement towards the first resistance level is evident. The first support level is located at 0.6640, and.
Author: Dean Leo
02:53 2023-03-21 UTC--4
1240
Show more
  • Grand Choice
    Contest by
    InstaForex
    InstaForex always strives to help you
    fulfill your biggest dreams.
    THAM GIA CUỘC THI
  • Tiền gửi lần truy cập
    Ký quỹ tài khoản của bạn với $3000 và nhận được $8000 nhiều hơn!
    Trong Tháng 3 chúng tôi xổ $8000 trong chiến dịch Chancy Deposit!
    Có được một cơ hội giành chiến thắng bằng việc ký quỹ $3000 vào một tài khoản giao dịch. Đáp ứng được điều kiện này, bạn trở thành một người tham gia chiến dịch.
    THAM GIA CUỘC THI
  • Giao dịch khôn ngoan, thành công
    Nạp tiền vào tài khoản của bạn với ít nhất $ 500, đăng ký cuộc thi và có cơ hội giành được các thiết bị di động.
    THAM GIA CUỘC THI
  • 100% tiền thưởng
    Cơ hội duy nhất của bạn để nhận 100% tiền thưởng khi gửi tiền
    NHẬN THƯỞNG
  • 55% Tiền thưởng
    Đăng ký tiền thưởng 55% cho mỗi lần gửi tiền của bạn
    NHẬN THƯỞNG
  • 30% tiền thưởng
    Nhận 30% tiền thưởng mỗi khi bạn nạp tiền vào tài khoản của mình
    NHẬN THƯỞNG

Recommended Stories

AUDUSD, H4 | Break out trendline?

Currently, the AUD/USD chart reflects bullish momentum, indicated by the break above a descending resistance line and the crossing above the Ichimoku cloud. The potential for continued bullish movement towards

Dean Leo 07:53 2023-03-21 UTC+2

EURUSD, Day | Potential reversel?

The EUR/USD pair has bullish momentum and may move towards the 1st resistance level. Pullback support at 1.0478, coinciding with the 38.20% Fibonacci retracement level, is currently supporting the price

Dean Leo 09:44 2023-03-20 UTC+2

GBPUSD, H4 | Potential reversel from trendline?

The GBP/USD chart currently exhibits bearish momentum, as the price remains below a significant descending trend line. This indicates that the currency pair may undergo further downward pressure

Dean Leo 08:05 2023-03-17 UTC+2

AUDUSD, H4 | Potential reversel from trendline?

Price is approaching our 1st resistance level at 0.6694 along with a 61.8% Fibonacci retracement. If the price were to break above, it could push up to 2nd resistance

Dean Leo 10:10 2023-03-16 UTC+2

USDJPY, H1 | Time to Buy?

The price has recently reversed from our 1st resistance level at 135.18, which lines up with the 50% Fibonacci retracement. Additionally, it appears that the price has broken through

Dean Leo 19:39 2023-03-15 UTC+2

DAX, D1 | Trend line breakout

Price has broken an ascending trend line suggesting we might see a big bearish move. There's also a strong bearish divergence vs Stochastic lending more confidence to our bearish call

Dean Leo 06:36 2023-03-14 UTC+2

USDCHF, H4 | Potential bearish breakout after trend line break?

Price is testing a major support at 0.9283 which is a 50% Fibonacci retracement and an overlap support. If price were to break this level, we could see it drop

Dean Leo 11:42 2023-03-10 UTC+2

GBPJPY, H4 | Could price bounce from here?

Price is testing a major support level at 161.80 which is an overlap support and also seeing support from an ascending trendline. There's a chance that it might bounce from

Dean Leo 18:21 2023-03-09 UTC+2

Can ETHUSD Drop to 1512?

Price is in a bearish channel and a reversal from 1591 could see prices drop all the way to 1512 which is a strong overlap support. Do watch

Dean Leo 17:39 2023-03-07 UTC+2

Potential WTI Rally?

Price is testing a major support of 78.37 which is an overlap support and a Fibonacci retracement. We could see a bounce from here taking prices up to 79.87. It's

Dean Leo 14:47 2023-03-06 UTC+2
Không thể nói chuyện ngay bây giờ?
Đặt câu hỏi của bạn trong phần trò chuyện.