empty
 
 
30.01.2023 07:14 PM
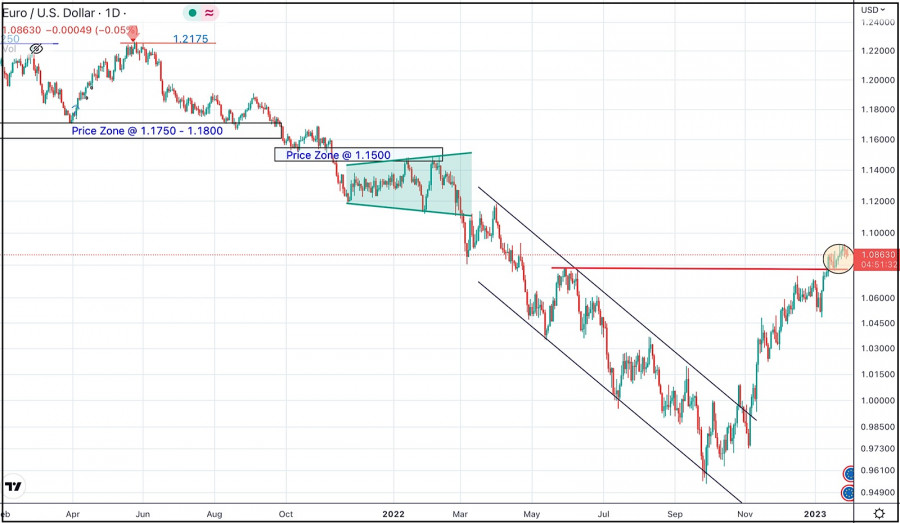
January 30, 2023 : EUR/USD daily technical review and trading opportunities.

This image is no longer relevant

The price zone around 1.1500 has applied significant SELLING pressure upon the previous ascending movement towards it.

Shortly after, the EUR/USD pair has been moving downwards reaching the price levels of 1.0850, 1.0400, 1.0000 and recently 0.9600.

The market has remained under buying pressure until a plateau level occurred around the key-zone around 1.0800-1.050.

In the mean time, any downside movement towards 1.0300 should be watched for BUYING pressure where a new upside movement can be established.

EURUSD
Euro vs US Dollar
Select timeframe
5
min
15
min
30
min
1
hour
4
hours
1
day
1
week
Start trade
Start trade
  • Grand Choice
    Contest by
    InstaForex
    InstaForex always strives to help you
    fulfill your biggest dreams.
    THAM GIA CUỘC THI
  • Tiền gửi lần truy cập
    Ký quỹ tài khoản của bạn với $3000 và nhận được $8000 nhiều hơn!
    Trong Tháng 3 chúng tôi xổ $8000 trong chiến dịch Chancy Deposit!
    Có được một cơ hội giành chiến thắng bằng việc ký quỹ $3000 vào một tài khoản giao dịch. Đáp ứng được điều kiện này, bạn trở thành một người tham gia chiến dịch.
    THAM GIA CUỘC THI
  • Giao dịch khôn ngoan, thành công
    Nạp tiền vào tài khoản của bạn với ít nhất $ 500, đăng ký cuộc thi và có cơ hội giành được các thiết bị di động.
    THAM GIA CUỘC THI
  • 100% tiền thưởng
    Cơ hội duy nhất của bạn để nhận 100% tiền thưởng khi gửi tiền
    NHẬN THƯỞNG
  • 55% Tiền thưởng
    Đăng ký tiền thưởng 55% cho mỗi lần gửi tiền của bạn
    NHẬN THƯỞNG
  • 30% tiền thưởng
    Nhận 30% tiền thưởng mỗi khi bạn nạp tiền vào tài khoản của mình
    NHẬN THƯỞNG

Recommended Stories

Video market update for March 28, 2023

Potential for the upside move on crude

Petar Jacimovic 12:54 2023-03-28 UTC+2

Forex forecast 03/28/2023 AUD/USD, EUR/USD, USD/CAD and Gold from Sebastian Seliga

Let's take a look at the technical picture of AUD/USD, EUR/USD, USD/CAD and Gold

Sebastian Seliga 10:51 2023-03-28 UTC+2

Indicator analysis: Daily review of GBP/USD on March 28, 2023

The pound-dollar pair may move upward from the level of 1.2282 (closing of yesterday's daily candle) to test 1.2352, the 85.4% pullback level (blue dotted line). When testing this level

Stefan Doll 09:57 2023-03-28 UTC+2

Indicator analysis: Daily review of EUR/USD on March 28, 2023

The euro-dollar pair may move upward from the level of 1.0796 (closing of yesterday's daily candle) to 1.0835, the 61.8% pullback level (red dotted line). Upon reaching this level, continued

Stefan Doll 09:46 2023-03-28 UTC+2

Technical Analysis of GBP/USD for March 28, 2023

Technical Market Outlook: The GBP/USD pair has broken below the short-term trend line support and made a new local low at the level of 1.2189 and is currently moving

Sebastian Seliga 08:30 2023-03-28 UTC+2

Technical Analysis of EUR/USD for March 28, 2023

Technical Market Outlook: The EUR/USD pair has broken below the short-term trend line support (orange line on chart) and made a local low at the level of 1.0712. Since then

Sebastian Seliga 08:29 2023-03-28 UTC+2

Analysis of Gold for March 28,.2023 - Bear flag pattern and potential for the downside continuation

Technical analysis: Gold has been trading downside yesterday and I see potential for the downside continuation today. Due to the downside momentum in the background and the bear flag pattern

Petar Jacimovic 08:16 2023-03-28 UTC+2

Technical Analysis of Daily Price Movement of Silver Commodity Asset, Tuesday March 28, 2023.

After testing the 22,964 level which is a significant resistance level on the daily chart of Silver commodity assets, it seems that in the next few days Silver

Arief Makmur 08:13 2023-03-28 UTC+2

Technical Analysis of Daily Price Movement Nasdaq 100 Index, Tuesday March 28, 2023.

On the daily chart, the Nasdaq 100 index shows the emergence of the Rising Wedge pattern where this pattern gives an indication that in the next few days #NDX

Arief Makmur 08:13 2023-03-28 UTC+2

USDCHF, H4 | Potential Reversal 1st support ?

The USD/CHF chart currently shows bearish momentum towards the first support level at 0.9120, a strong swing low support level. A second support level is also present at 0.9059

Dean Leo 08:12 2023-03-28 UTC+2
Không thể nói chuyện ngay bây giờ?
Đặt câu hỏi của bạn trong phần trò chuyện.