empty
 
 
31.01.2023 10:08 AM
USDCAD Potential for Bullish Rise towards overlap resistance

This image is no longer relevant

Description :

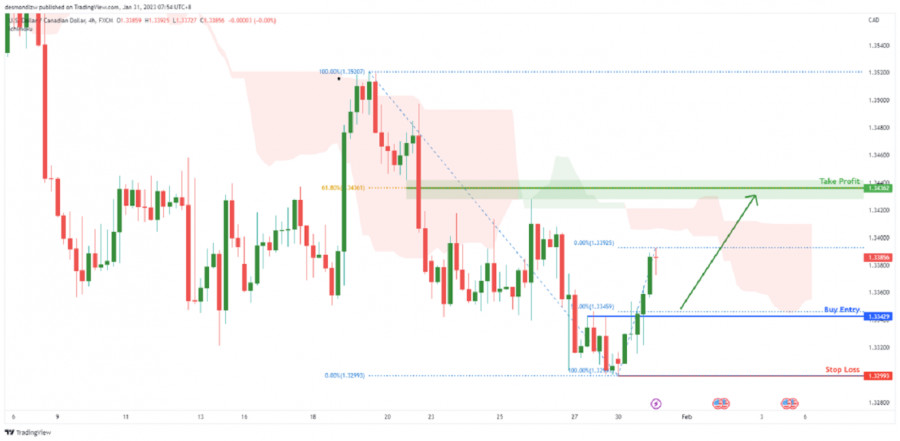
Looking at the H4 chart, my overall bias for USCAD is bullish due to the current price heading towards the Ichimoku cloud, indicating a bullish market. Looking for a pullback buy entry at 1.33429, where the overlap support and 50% Fibonacci line is. Stop loss will be at 1.32993, where the recent swing low is. Take profit will be at 1.34362, where the overlap resistance and 61.8% Fibonacci line is.

Trading Recommendation

Entry: 1.33429

Reason for Entry: Overlap resistance and 38.2% Fibonacci line

Take Profit: 1.34362

Reason for Take Profit:

Overlap resistance and 61.8% Fibonacci line

Stop Loss: 1.32993

Reason for Stop Loss:

Recent swing low

USDCAD
US Dollar vs Canadian
Select timeframe
5
min
15
min
30
min
1
hour
4
hours
1
day
1
week
Start trade
Start trade
USDCHF, H4 | Potential Reversal 1st support ?
The USD/CHF chart currently shows bearish momentum towards the first support level at 0.9120, a strong swing low support level. A second support level is also present at 0.9059. On the upside, the first resistance level is at 0.9208, an overlap resistance level, with a potential retracement level..
Author: Dean Leo
02:12 2023-03-28 UTC--4
2155
NZDUSD, H4 | Continue to 1st Resistance?
The momentum of NZD/USD is bullish, with price above a major ascending trend line indicating potential for further bullish momentum. The first support level is at 0.6180, a swing low support, with the second support level at 0.6144 being an overlap support and significant Fibonacci retracement.
Author: Dean Leo
02:10 2023-03-28 UTC--4
2185
US500, H4 | Ascending trendline ?
US500 chart is bullish, with price above a major ascending trend line, potential for bullish continuation to first resistance. First support level at 3903.06 is a strong multi-swing low support, with second support at 3843.60. First resistance level at 4001.11 is a multi-swing high resistance, with.
Author: Dean Leo
02:04 2023-03-28 UTC--4
1720
Show more
  • Grand Choice
    Contest by
    InstaForex
    InstaForex always strives to help you
    fulfill your biggest dreams.
    THAM GIA CUỘC THI
  • Tiền gửi lần truy cập
    Ký quỹ tài khoản của bạn với $3000 và nhận được $8000 nhiều hơn!
    Trong Tháng 3 chúng tôi xổ $8000 trong chiến dịch Chancy Deposit!
    Có được một cơ hội giành chiến thắng bằng việc ký quỹ $3000 vào một tài khoản giao dịch. Đáp ứng được điều kiện này, bạn trở thành một người tham gia chiến dịch.
    THAM GIA CUỘC THI
  • Giao dịch khôn ngoan, thành công
    Nạp tiền vào tài khoản của bạn với ít nhất $ 500, đăng ký cuộc thi và có cơ hội giành được các thiết bị di động.
    THAM GIA CUỘC THI
  • 100% tiền thưởng
    Cơ hội duy nhất của bạn để nhận 100% tiền thưởng khi gửi tiền
    NHẬN THƯỞNG
  • 55% Tiền thưởng
    Đăng ký tiền thưởng 55% cho mỗi lần gửi tiền của bạn
    NHẬN THƯỞNG
  • 30% tiền thưởng
    Nhận 30% tiền thưởng mỗi khi bạn nạp tiền vào tài khoản của mình
    NHẬN THƯỞNG

Recommended Stories

US500, H4 | Ascending trendline ?

US500 chart is bullish, with price above a major ascending trend line, potential for bullish continuation to first resistance. First support level at 3903.06 is a strong multi-swing low support

Dean Leo 08:04 2023-03-28 UTC+2

WIT(OIL), Day | Strong descending trendline ?

WTI oil prices have turned bearish as they fell below a crucial support level. The chart indicates that the momentum has shifted to the downside, signaling a potential further decline

Dean Leo 07:46 2023-03-27 UTC+2

USDJPY, H4 | Strong descending trendline ?

The USD/JPY pair currently has a weak momentum with low confidence due to its position below a major descending trend line, indicating possible bearish momentum. Breaking off from the first

Dean Leo 06:07 2023-03-24 UTC+2

USDCAD, H4 | Respected descending trendline ?

The charts indicate that the USD/CAD currency pair is currently experiencing a bearish momentum, with price situated below a significant descending trend line. As such, it is likely that

Dean Leo 06:55 2023-03-23 UTC+2

USD/JPY, H4 | Break out trendline?

The USD/JPY chart currently reflects a bullish momentum as it is trading above a significant ascending trend line, indicating potential for further bullish movement. In case the price manages

Dean Leo 06:37 2023-03-22 UTC+2

AUDUSD, H4 | Break out trendline?

Currently, the AUD/USD chart reflects bullish momentum, indicated by the break above a descending resistance line and the crossing above the Ichimoku cloud. The potential for continued bullish movement towards

Dean Leo 07:53 2023-03-21 UTC+2

EURUSD, Day | Potential reversel?

The EUR/USD pair has bullish momentum and may move towards the 1st resistance level. Pullback support at 1.0478, coinciding with the 38.20% Fibonacci retracement level, is currently supporting the price

Dean Leo 09:44 2023-03-20 UTC+2

GBPUSD, H4 | Potential reversel from trendline?

The GBP/USD chart currently exhibits bearish momentum, as the price remains below a significant descending trend line. This indicates that the currency pair may undergo further downward pressure

Dean Leo 08:05 2023-03-17 UTC+2

AUDUSD, H4 | Potential reversel from trendline?

Price is approaching our 1st resistance level at 0.6694 along with a 61.8% Fibonacci retracement. If the price were to break above, it could push up to 2nd resistance

Dean Leo 10:10 2023-03-16 UTC+2

USDJPY, H1 | Time to Buy?

The price has recently reversed from our 1st resistance level at 135.18, which lines up with the 50% Fibonacci retracement. Additionally, it appears that the price has broken through

Dean Leo 19:39 2023-03-15 UTC+2
Không thể nói chuyện ngay bây giờ?
Đặt câu hỏi của bạn trong phần trò chuyện.