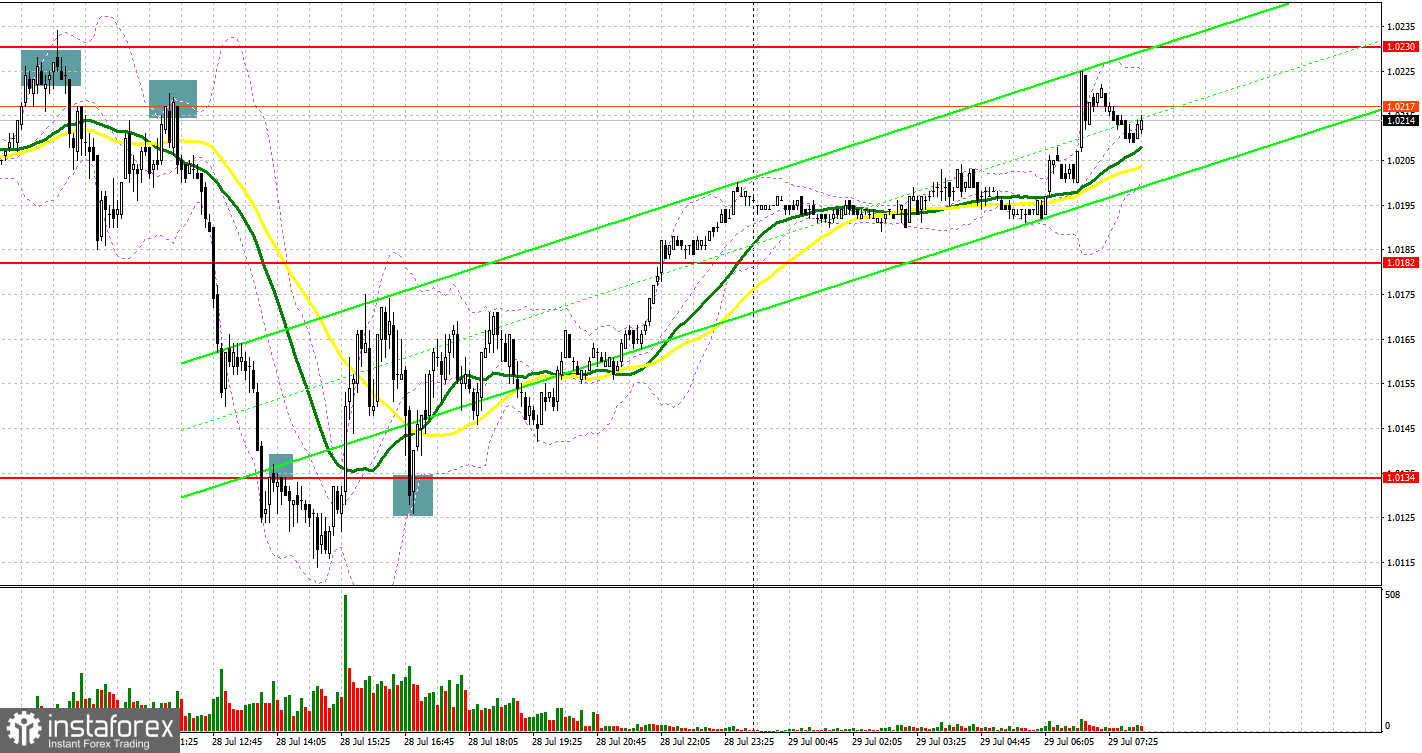
Several excellent market entry signals were formed yesterday. Let's take a look at the 5-minute chart and see what happened. I paid attention to the 1.0220 level in my morning forecast and advised that you make decisions on entering the market from it. Growth in continuation of yesterday's bullish rally and an unsuccessful attempt to consolidate above 1.0220 - all this resulted in an excellent signal to sell the euro. After that, the pair fell by 30 points. But, even if you did not have time to take advantage of this moment, you could always sell the euro after another upward move to the 1.0220 area and a similar false breakout. This time the pair fell by more than 70 points. A breakthrough and reverse test of 1.0134 in the afternoon led to another sell signal, as a result of which the pair fell 20 points. US GDP data influenced the course of the market, which changed its direction. After a return to 1.0134, a reverse test from the top down of this range gave an excellent buy signal, which resulted in the euro gaining more than 60 points.
When to go long on EUR/USD:
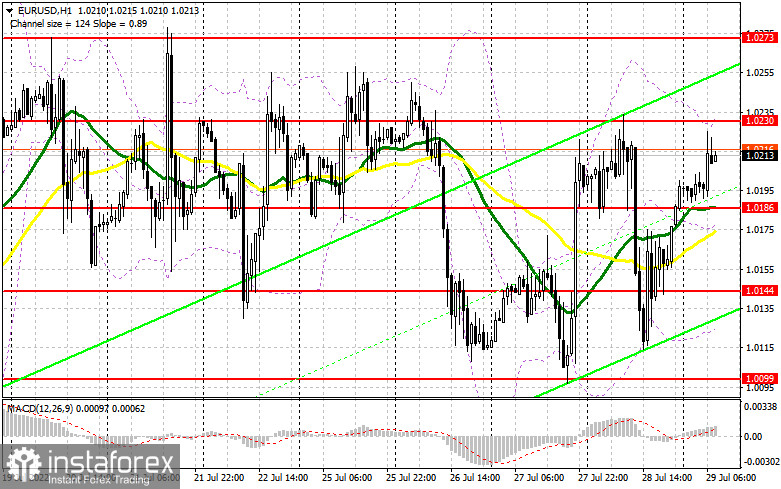
The 0.9% contraction of US GDP in the 2nd quarter of this year led to the beginning of the official recession of the economy, as the fall in growth was observed for the second consecutive quarter. Against this background, the euro rose, but there may be problems with further upward correction. Today we are waiting for a huge number of statistics on the eurozone countries, which may negatively affect the pair's direction, which will limit its upward potential. I advise you to focus on reports on changes in the volume of GDP in Germany and the eurozone, as well as on the consumer price index of the eurozone. GDP growth will be a good signal to open long positions in the euro, but something I very much doubt that the eurozone economy will be better than the US economy. Rising inflation will pull the euro down, as this will have a negative impact on consumer spending and, accordingly, on the economy itself. In case the euro falls after we receive the data, forming a false breakout in the area of 1.0186 will provide the first signal to open long positions in hopes of continuing yesterday's upward trend with the prospect of updating resistance at 1.0230. In the area of 1.0186, moving averages are playing on the bulls' side, which will also be a plus. A downside breakthrough and test of 1.0230 will hit the bears' stop orders, creating another signal to enter longs with the possibility of a larger increase to 1.0273, on which quite a lot will depend. The farthest target will be the area of 1.0323, where I recommend taking profits.
If the EUR/USD falls and there are no bulls at 1.0186, which cannot be ruled out either, the pressure on the pair will increase, but this will not lead to a break in the upward trend. In this case, I advise you not to rush to enter the market: the best option for opening longs would be a false breakout in the area of 1.0144. I advise you to buy EUR/USD immediately on a rebound only from the level of 1.0099, or even lower - in the region of 1.0045, counting on an upward correction of 30-35 points within the day.
When to go short on EUR/USD:
The bears were defeated yesterday after weak reports in the afternoon. Now, only weak data for Germany and the eurozone will be able to stop the bull market, which developed during the US session. To return the pressure on EUR/USD, protecting resistance at 1.0230 is necessary, the breakdown of which will return the pair to monthly highs. Forming a false breakout there will provide an excellent signal to open short positions with the prospect of a decline to the intermediate support area of 1.0186, where the moving averages are. A breakthrough and consolidation below this level, as well as a reverse test from the bottom up - all this will lead to another sell signal with the removal of bulls' stops and a larger movement of the pair to the 1.0144 area. Consolidating below this area is a direct road to 1.0099, where I recommend completely leaving short positions. A more distant target will be the area of 1.0045, but it will be available only if we receive very strong US data.
In case EUR/USD moves higher during the European session, as well as the absence of bears at 1.0230, which is more likely, I advise you to postpone short positions to this month's high of 1.0273. Forming a false breakout there will be a new starting point for entering shorts. You can sell EUR/USD immediately on a rebound from the high of 1.0323, or even higher - in the area of 1.0374, counting on a downward correction of 30-35 points.
COT report:
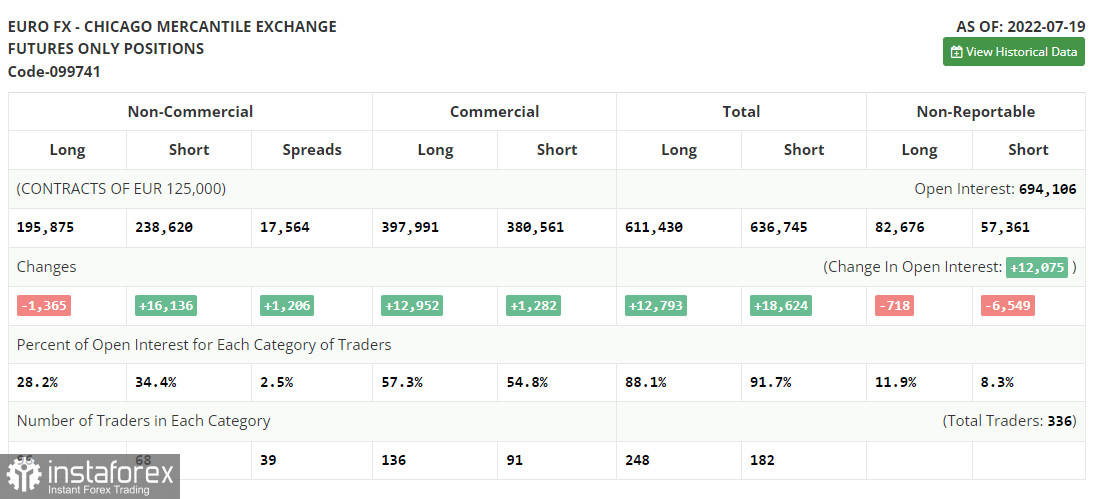
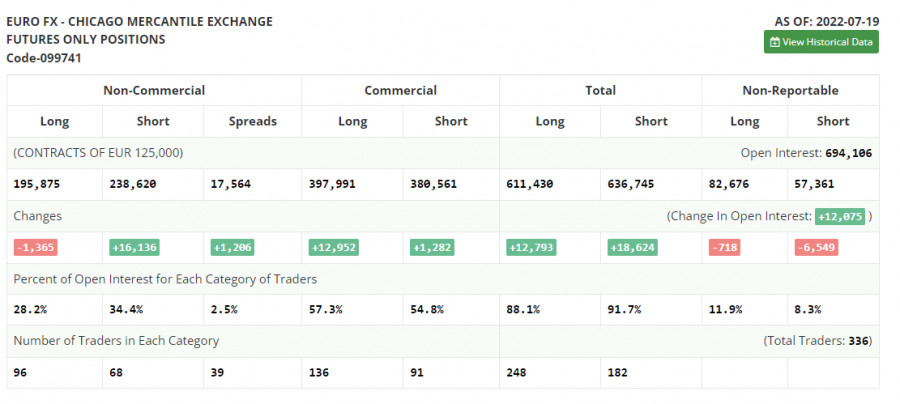
The Commitment of Traders (COT) report for July 19 logged an increase in short positions and a reduction in long positions, which indicates that the bearish sentiment in the market remains. This has also resulted in a larger negative delta, suggesting that there are still not as many bulls as one might think. Last week, the European Central Bank raised interest rates by 0.5% at once, which was beyond the expected forecast of 0.25%. This indicates the seriousness of the situation in the euro area with inflation. However, the markets reacted poorly to this decision, and traders took a wait-and-see attitude before an important Federal Reserve meeting, the results of which will be known in the middle of this week. The fact that the euro has not risen once again indicates the likelihood of a further decline in risky assets this autumn, since there are no real reasons for the EUR/USD to strengthen: high inflation, a crisis in the energy market and the economy is rapidly slipping into recession. The COT report indicated that long non-commercial positions decreased by 1,365 to 195,875, while short non-commercial positions jumped 16,136 to 238,620. At the end of the week, the total non-commercial net position remained negative and amounted to -42,745 against -25,244. The weekly closing price slightly increased and amounted to 1.0278 against 1.0094.
Indicator signals:
Moving averages
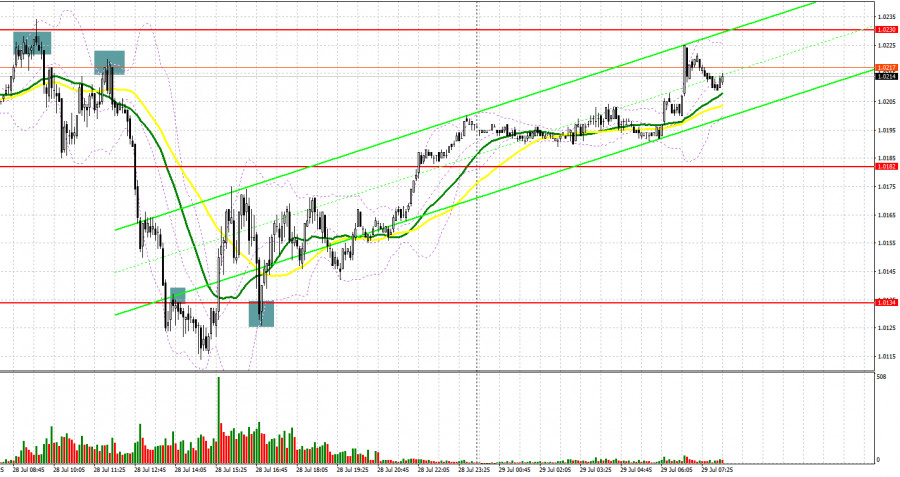
Trading is above the 30 and 50-day moving averages, which indicates the likelihood of further growth in the euro.
Note: The period and prices of moving averages are considered by the author on the H1 hourly chart and differs from the general definition of the classic daily moving averages on the daily D1 chart.
Bollinger Bands
In case of a decline, the lower border of the indicator around 1.0120 will act as support. In case of growth, the upper border of the indicator in the area of 1.0230 will act as resistance.
Description of indicators
- Moving average (moving average, determines the current trend by smoothing out volatility and noise). Period 50. It is marked in yellow on the chart.
- Moving average (moving average, determines the current trend by smoothing out volatility and noise). Period 30. It is marked in green on the chart.
- MACD indicator (Moving Average Convergence/Divergence — convergence/divergence of moving averages) Quick EMA period 12. Slow EMA period to 26. SMA period 9
- Bollinger Bands (Bollinger Bands). Period 20
- Non-commercial speculative traders, such as individual traders, hedge funds, and large institutions that use the futures market for speculative purposes and meet certain requirements.
- Long non-commercial positions represent the total long open position of non-commercial traders.
- Short non-commercial positions represent the total short open position of non-commercial traders.
- Total non-commercial net position is the difference between short and long positions of non-commercial traders.