empty
 
 
08.12.2022 09:21 AM
Indicator analysis of EUR/USD on December 8

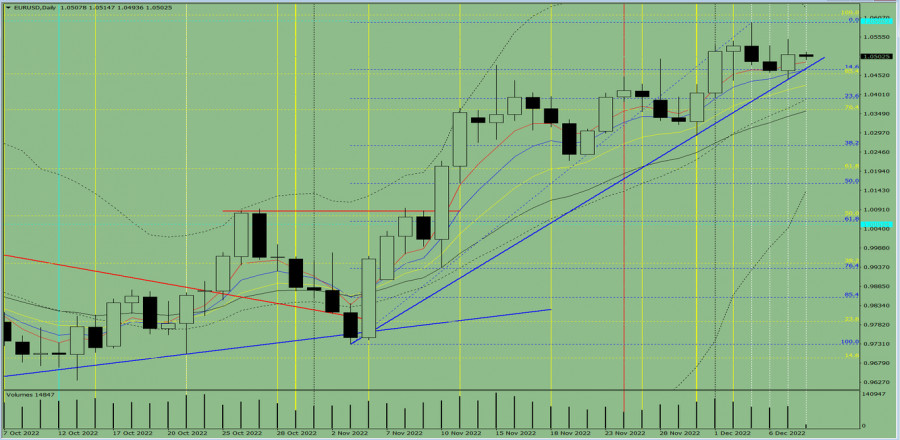
Trend analysis (fig. 1).

Today, the pair may decline to the support level of 1.0471 (blue bold line) from 1.0508 (closing of the daily candlestick). From this level, the price may go up. If so, it is likely to reach the upper fractal of 1.0594 (blue dotted line).

This image is no longer relevant

Fig. 1 (daily chart).

Complex analysis:

- indicator analysis– up;

- Fibonacci levels – down;

- trading volumes – down;

- candlestick analysis – up;

- trend analysis – up;

- Bollinger lines – up;

- weekly chart-up.

Conclusion:

Today, the pair may decline to the support level of 1.0471 (blue bold line) from 1.0508 (closing of the daily candlestick). From this level, the price may go up. If so, it is likely to reach the upper fractal of 1.0594 (blue dotted line).

Alternatively, the pair could drop to the 13 average EMA of 1.0426 (yellow thin line) from 1.0508 (closing of yesterday's daily candlestick). From this level, the price is likely to climb to the upper fractal of 1.0594 (blue dotted line).

Stefan Doll,
Chuyên gia phân tích của InstaForex
© 2007-2023
EURUSD
Euro vs US Dollar
Select timeframe
5
min
15
min
30
min
1
hour
4
hours
1
day
1
week
Start trade
Start trade
  • Grand Choice
    Contest by
    InstaForex
    InstaForex always strives to help you
    fulfill your biggest dreams.
    THAM GIA CUỘC THI
  • Tiền gửi lần truy cập
    Ký quỹ tài khoản của bạn với $3000 và nhận được $8000 nhiều hơn!
    Trong Tháng 3 chúng tôi xổ $8000 trong chiến dịch Chancy Deposit!
    Có được một cơ hội giành chiến thắng bằng việc ký quỹ $3000 vào một tài khoản giao dịch. Đáp ứng được điều kiện này, bạn trở thành một người tham gia chiến dịch.
    THAM GIA CUỘC THI
  • Giao dịch khôn ngoan, thành công
    Nạp tiền vào tài khoản của bạn với ít nhất $ 500, đăng ký cuộc thi và có cơ hội giành được các thiết bị di động.
    THAM GIA CUỘC THI
  • 100% tiền thưởng
    Cơ hội duy nhất của bạn để nhận 100% tiền thưởng khi gửi tiền
    NHẬN THƯỞNG
  • 55% Tiền thưởng
    Đăng ký tiền thưởng 55% cho mỗi lần gửi tiền của bạn
    NHẬN THƯỞNG
  • 30% tiền thưởng
    Nhận 30% tiền thưởng mỗi khi bạn nạp tiền vào tài khoản của mình
    NHẬN THƯỞNG

Recommended Stories

March 31, 2023 : EUR/USD daily technical review and trading opportunities.

The price level of 1.0930 remained a significant resistance level to offer SELL opportunities until the recent upside movement temporarily extended up to 1.1000. That's why, the next target

Mohamed Samy 20:03 2023-03-31 UTC+2

March 31, 2023 : EUR/USD Intraday technical analysis and trading plan.

Price action around the key-level of (1.0550-1.0600) was quite bullish. That's why, further bullish continuation towards 1.0800 was demonstrated. Moreover, more bullish advancement towards the nearest supply zone around 1.1150-1.1200

Mohamed Samy 20:02 2023-03-31 UTC+2

March 31, 2023 : GBP/USD Intraday technical analysis and significant key-levels.

The GBPUSD bulls failed to record a new high. Instead, a descending high was established around the same price level. Bearish pullback pursued towards the price levels of 1.1800. This

Mohamed Samy 20:01 2023-03-31 UTC+2

NZD/USD standing below strong upside obstacle

The NZD/USD pair is located at 0.6263 at the time of writing. As you can see on the H1 chart, it stands below 0.6273 - 0.6291 supply zone (upside obstacle)

Ralph Shedler 18:58 2023-03-31 UTC+2

Trading Signal for GOLD (XAU/USD) for March 31, 2023: sell below $1,979 (21 SMA - symmetrical triangle)

In the chart above, we can observe a symmetrical triangle formation. The break below 1,960 could confirm a bearish movement in the short. In the medium term, the price could

Dimitrios Zappas 16:24 2023-03-31 UTC+2

USD/CAD: upside reversal needs confirmation

The USD/CAD pair crashed in the last hours and it seems determined to reach and retest the near-term support levels before developing a new bullish momentum. After its massive drop

Ralph Shedler 15:59 2023-03-31 UTC+2

Monthly USDJPY analysis and the Inverted head and shoulders pattern

In previous posts we have talked about the major bullish pattern of the inverted head and shoulders pattern in USDJPY. We have posted the monthly chart several times even before

Alexandros Yfantis 13:56 2023-03-31 UTC+2

Technical analysis on EURUSD for March 31st, 2023.

EURUSD is trading around 1.0886. Price is under pressure today. Price has so far respected the key support neckline and cancelled the bearish Head and Shoulders pattern. At the same

Alexandros Yfantis 12:01 2023-03-31 UTC+2

Technical analysis on NZDUSD for March 31st, 2023.

NZDUSD is trading around 0.6260. Price recently tested the black neckline resistance for the 4th time and it seems it is getting rejected once again. In the near term price

Alexandros Yfantis 11:55 2023-03-31 UTC+2

Technical analysis on Gold for March 31st, 2023.

Gold price is trading around $1,979. Price remains inside the triangle pattern we mentioned in our previous analysis. Price has reached the short-term resistance level of $1,983 where we find

Alexandros Yfantis 11:52 2023-03-31 UTC+2
Không thể nói chuyện ngay bây giờ?
Đặt câu hỏi của bạn trong phần trò chuyện.