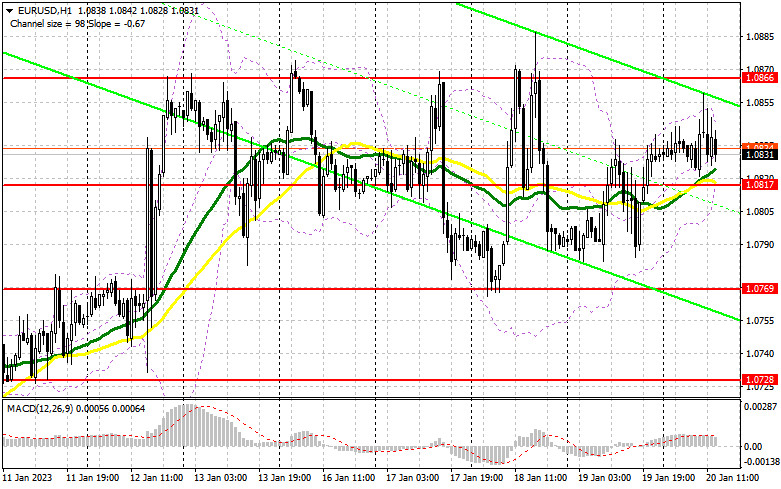
When to open long positions on EUR/USD:
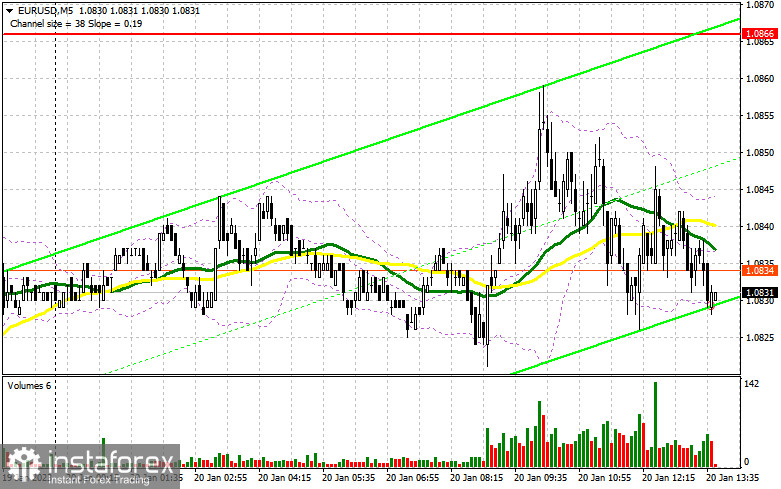
In the morning article, I turned your attention to 1.0817 and recommended making decisions with this level in focus. Now, let's look at the 5-minute chart and figure out what actually happened. Now, let's look at the 5-minute chart and figure out what actually happened. A false breakout did not take place as volatility remained low. The bulls tried to push the pair to 1.0866 but they failed. For the afternoon, the technical outlook has not changed as well as the trading strategy.
In the American session, the US will unveil its existing home sales report. Fed policymakers Patrick Harper and Christopher Wallace will deliver speeches. An increase in existing home sales may boost the US dollar. However, less hawkish remarks from Fed members, on the contrary, will undermine bullish sentiment. In this case, the euro/dollar pair may settle above 1.0817. A decline and a false breakout of this level could will give a buy signal with the prospect of a rise to 1.0866. The pair has failed to approach this level once. A breakout and a downward retest of this level look likely only amid weak US data and dovish comments from Fed policymakers. A breakout of 1.0866 will generate an additional entry point into long positions with the likelihood of a jump to 1.0931. Only a breakout of this level will force bears to close their Stop Loss orders and give an additional buy signal with the possibility of an increase to 1.0970. At this level, I recommend locking in profits. If EUR/USD declines and buyers show no activity at 1.0817, a larger correction of the euro may begin, which could escalate pressure on the pair at the end of the week. Moving averages passing at this level are benefiting bulls. Therefore, it is better to pay attention to the support level of 1.0769, which is the lower border of the sideways channel. There, a false breakout will provide a new buying opportunity. You could buy EUR/USD after a bounce from the low of 1.0728 or 1.0687, keeping in mind an upward intraday correction of 30-35 pips.
When to open short positions on EUR/USD:
The bears failed to push the pair to 1.0817. This is why this level remains the target one for them. The further trajectory of the pair will largely depend on US data. However, as I have mentioned above, the speeches of Fed members are of large importance. The pair may decline to 1.0817 amid the hawkish comments. A breakout and an upward retest of this level will create a sell signal with the aim of moving back to 1.0769. A drop below this level could trigger a larger correction to 1.0728. It will initiate the bear market. At this level, I recommend locking in profits. If EUR/USD grows during the American session, I would advise you to consider short positions at 1.0866, the upper border of the sideways channel. The euro has already fallen several times from this level. A false breakout there will give a sell signal. If the pair does not slip considerably from 1.0866 in the afternoon, I would advise you to open short positions only from a high of 1.0931 after a false breakdown. You could sell EUR/USD at a bounce from a high of 1.0970, keeping in mind a downward intraday correction of 30-35 pips.
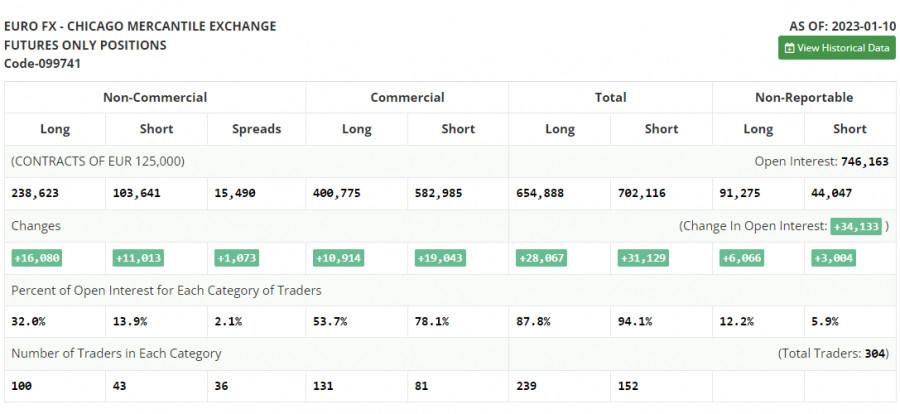
COT report
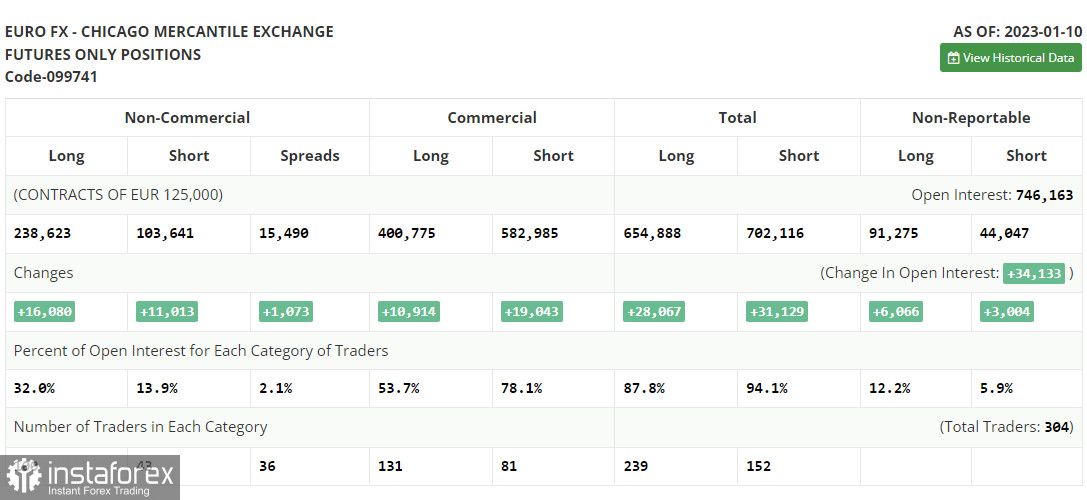
The COT report (Commitment of Traders) for January 10 logged a sharp increase in both long and short positions. Traders are returning to markets after the New Year holidays. They have also studied the fresh inflation report, showing a decrease in the CPI in December 2022. The Fed could undertake a smaller rate increase at its February meeting and raise the interest rate by only 0.25 basis points. Such a scenario will be extremely bearish for the US dollar. It is likely to drop significantly against the euro. Demand for risky assets is also growing thanks to expectations of a slowdown in monetary tightening. Assets that have fallen in price over the past year are now attractive to investors. Now, it is necessary to focus on the speeches of Fed policymakers and draw certain conclusions about the February meeting results. The COT report revealed that long non-profit positions increased by 16,080 to 238,623, while short non-profit positions jumped by 11,013 to 103,641. At the end of the week, the total non-commercial net position advanced to 134,982 against 129,915. Hence, investors continue to increase long positions on the euro amid expectations of a smaller rate hike. However, the euro needs new drivers for further growth. The weekly closing price rose to 1.0787 against 1.0617.
Indicators' signals:
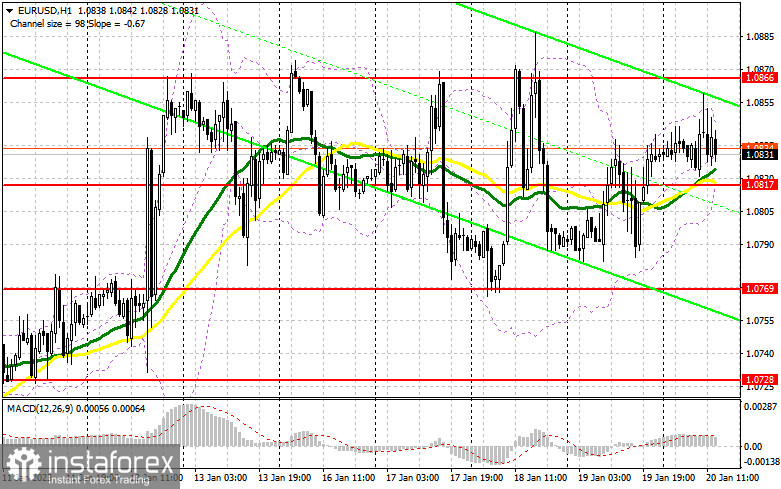
Trading is carried out slightly above the 30 and 50 daily moving averages. It indicates that the bulls are making efforts to take control.
Moving averages
Note: The period and prices of moving averages are considered by the author on the H1 (1-hour) chart and differ from the general definition of the classic daily moving averages on the daily D1 chart.
Bollinger Bands
If EUR/USD moves up, the indicator's upper border at 1.0850 will serve as resistance.
Description of indicators
- Moving average (moving average, determines the current trend by smoothing out volatility and noise). Period 50. It is marked yellow on the chart.
- Moving average (moving average, determines the current trend by smoothing out volatility and noise). Period 30. It is marked green on the chart.
- MACD indicator (Moving Average Convergence/Divergence — convergence/divergence of moving averages) Quick EMA period 12. Slow EMA period to 26. SMA period 9
- Bollinger Bands (Bollinger Bands). Period 20
- Non-commercial speculative traders, such as individual traders, hedge funds, and large institutions that use the futures market for speculative purposes and meet certain requirements.
- Long non-commercial positions represent the total long open position of non-commercial traders.
- Short non-commercial positions represent the total short open position of non-commercial traders.
- Total non-commercial net position is the difference between the short and long positions of non-commercial traders.