When to open long positions on EUR/USD:
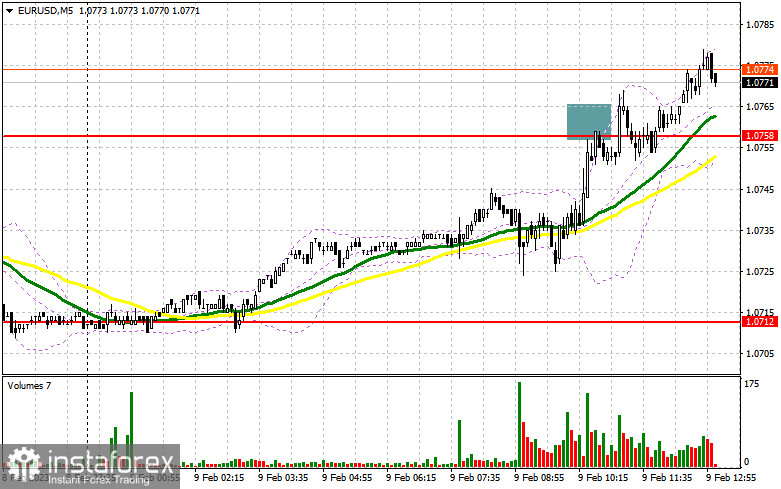
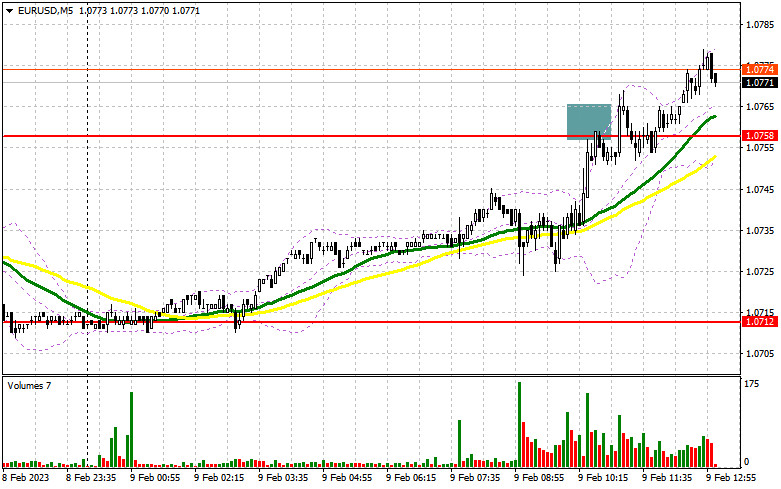
In my morning article, I turned your attention to 1.0758 and recommended making decisions with this level in focus. Now, let's look at the 5-minute chart and figure out what actually happened. A sharp rise in the euro in the morning led to a false breakout of 1.0758. However, the EUR/USD pair failed to start a downward movement. I had to close Stop Loss orders as the pair broke above 1.0758 on the second attempt. After that, it rose even higher. In the afternoon, the technical outlook was slightly revised.
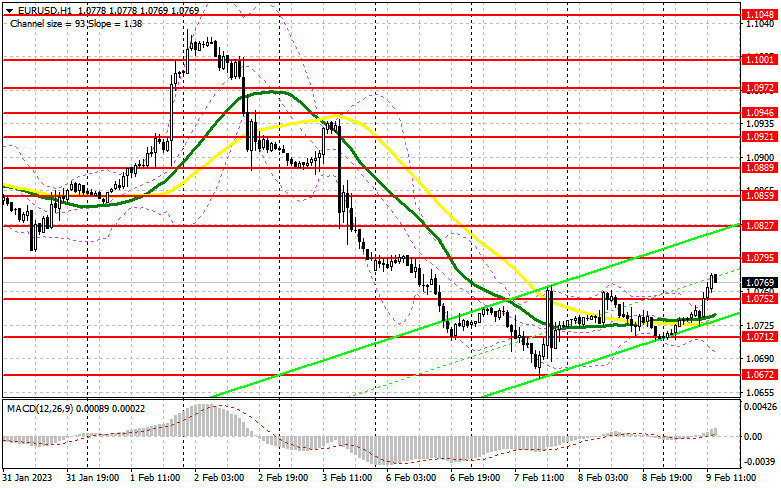
During the American session, the US will unveil its initial jobless claims report. However, traders will take notice of it only if the reading exceeds forecasts. An increase in the number of jobless claims will escalate pressure on the US dollar and lead to the robust growth of the euro. If the bearish pressure on EUR/USD returns in the afternoon, a downward movement to the support of 1.0752 may occur. I would advise you to make trading decisions from this level. Only after a false breakout of this level, one should go long. The euro could grow to 1.0795. Notably, it failed to approach this level today in the morning. A breakout and a downward retest of this level will create an additional entry point into long positions with an increase to 1.0827. A breakout of this level will also force the bears to close their Stop Loss orders and give a buy signal with the prospect of an increase to 1.0859. At this level, I recommend locking in profits. However, the pair is unlikely to show a drastic upward movement today. If EUR/USD declines and buyers show no activity at 1.0752 in the afternoon, bears will try to regain the upper hand. If so, the pair could even slide into the sideways channel. In this case, one should shift attention to the support level of 1.0712. The moving averages are passing above this level. They are benefiting the bulls. Only a false breakout of this level there will generate new entry points into long positions. You could buy EUR/USD at a bounce from 1.0672 or 1.0618, keeping in mind an upward intraday correction of 30-35 pips.
When to open short on positions on EUR/USD:
It is better to wait for a false breakout of 1.0795 before opening short positions. Bulls are now trying to recoup losses incurred last week. A false breakout of 1.0795 will indicate that large sellers have entered the market. It will create an entry point into short positions with the likelihood of a drop to 1.0752, the support level formed in the morning. A breakout and an upward retest of this level will give a sell signal with a decline to an intraday low of 1.0712. If so, a larger downward correction may take place. A decrease below this level amid a sharp fall in US jobless claims and hawkish comments from Fed policymakers will cause a stepper fall to 1.0672. At this level, I recommend locking in profits. If EUR/USD climbs during the American session and bears show no energy at 1.0795, the pair could move higher. In this case, I would advise you to postpone short positions until a breakout of 1.0827. You could sell EUR/USD at a bounce from a high of 1.0859, keeping in mind a downward intraday correction of 30-35 pips.
COT report
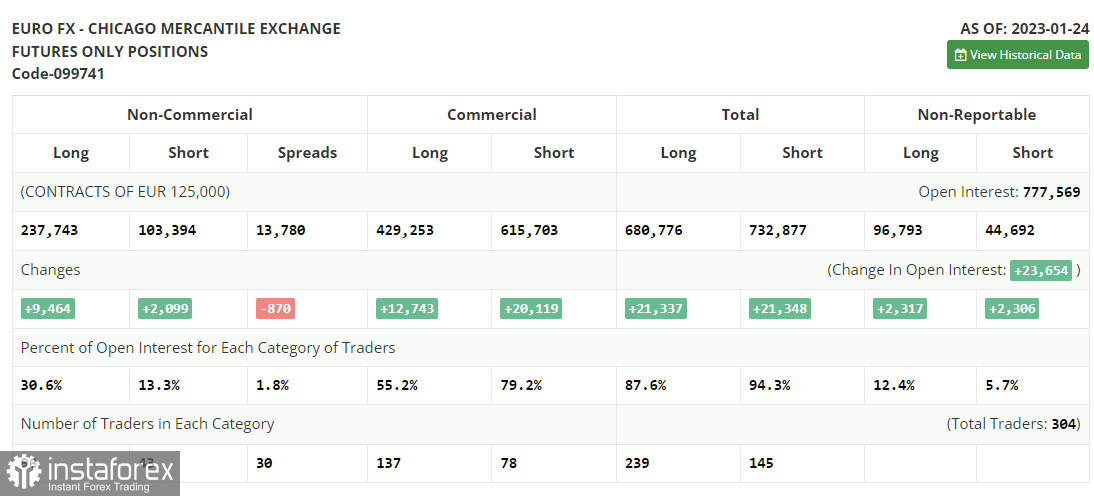
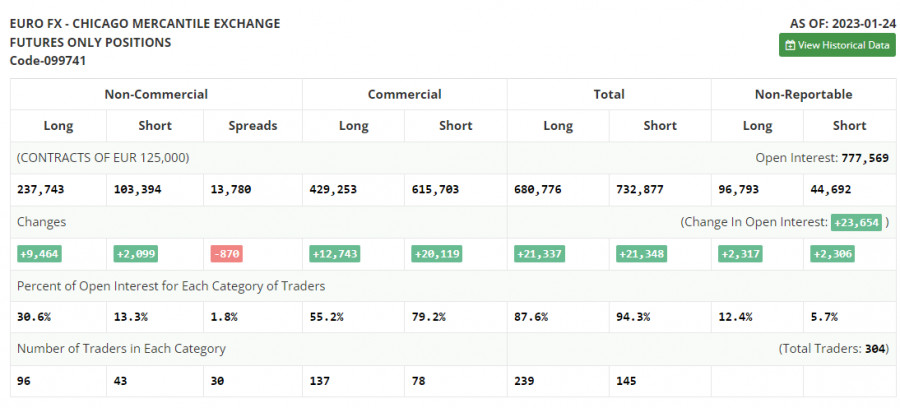
The COT report for January 24 logged a rise in both short and long positions. Traders have significantly increased long positions following hawkish speeches of ECB policymakers. They are betting on further monetary tightening by the ECB and the Fed's dovish stance. The US regulator may reduce the pace of tightening for the second time in a row. Weak macro stats on the US economy, namely a drop in retail sales and a slowdown in inflation may force the central bank to take a pause in rate hikes to avoid any damage. This week, several central banks will hold their meetings. Their results will eventually determine the trajectory of the euro/dollar pair. According to the COT report, the long positions of the non-commercial group of traders increased by 9,464 to 237,743 while short positions advanced by 2,099 to 103,394. At the end of the week, the total non-commercial net position rose to 134,349 from 126,984. It appears investors believe in the upside potential of the euro. Nevertheless, they are waiting for more clues from central banks regarding interest rates. The weekly closing price grew to 1.0919 from 1.0833.
Indicators' signals:
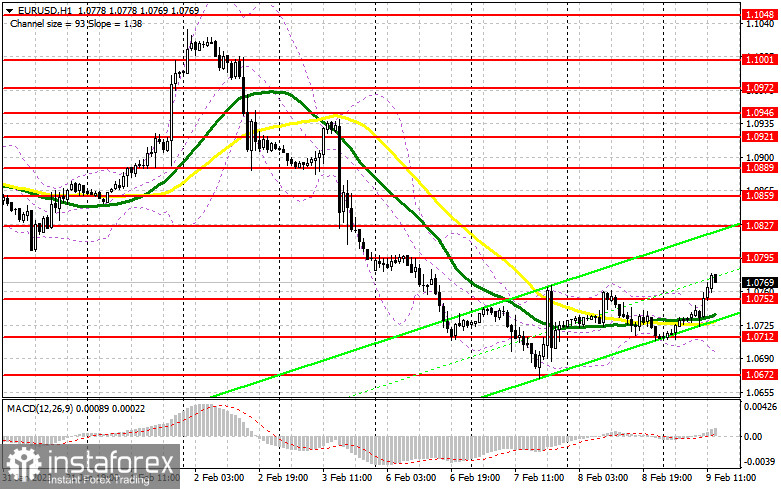
Trading is carried out above the 30 and 50 daily moving averages, which indicates the likelihood of further recovery of the euro.
Moving averages
Note: The period and prices of moving averages are considered by the author on the H1 (1-hour) chart and differ from the general definition of the classic daily moving averages on the daily D1 chart.
Bollinger Bands
If EUR/USD declines, the indicator's lower border at 1.0710 will serve as support.
Description of indicators
- Moving average (moving average, determines the current trend by smoothing out volatility and noise). Period 50. It is marked yellow on the chart.
- Moving average (moving average, determines the current trend by smoothing out volatility and noise). Period 30. It is marked green on the chart.
- MACD indicator (Moving Average Convergence/Divergence - convergence/divergence of moving averages) Quick EMA period 12. Slow EMA period to 26. SMA period 9
- Bollinger Bands (Bollinger Bands). Period 20
- Non-commercial speculative traders, such as individual traders, hedge funds, and large institutions that use the futures market for speculative purposes and meet certain requirements.
- Long non-commercial positions represent the total long open position of non-commercial traders.
- Short non-commercial positions represent the total short open position of non-commercial traders.
- Total non-commercial net position is the difference between the short and long positions of non-commercial traders.