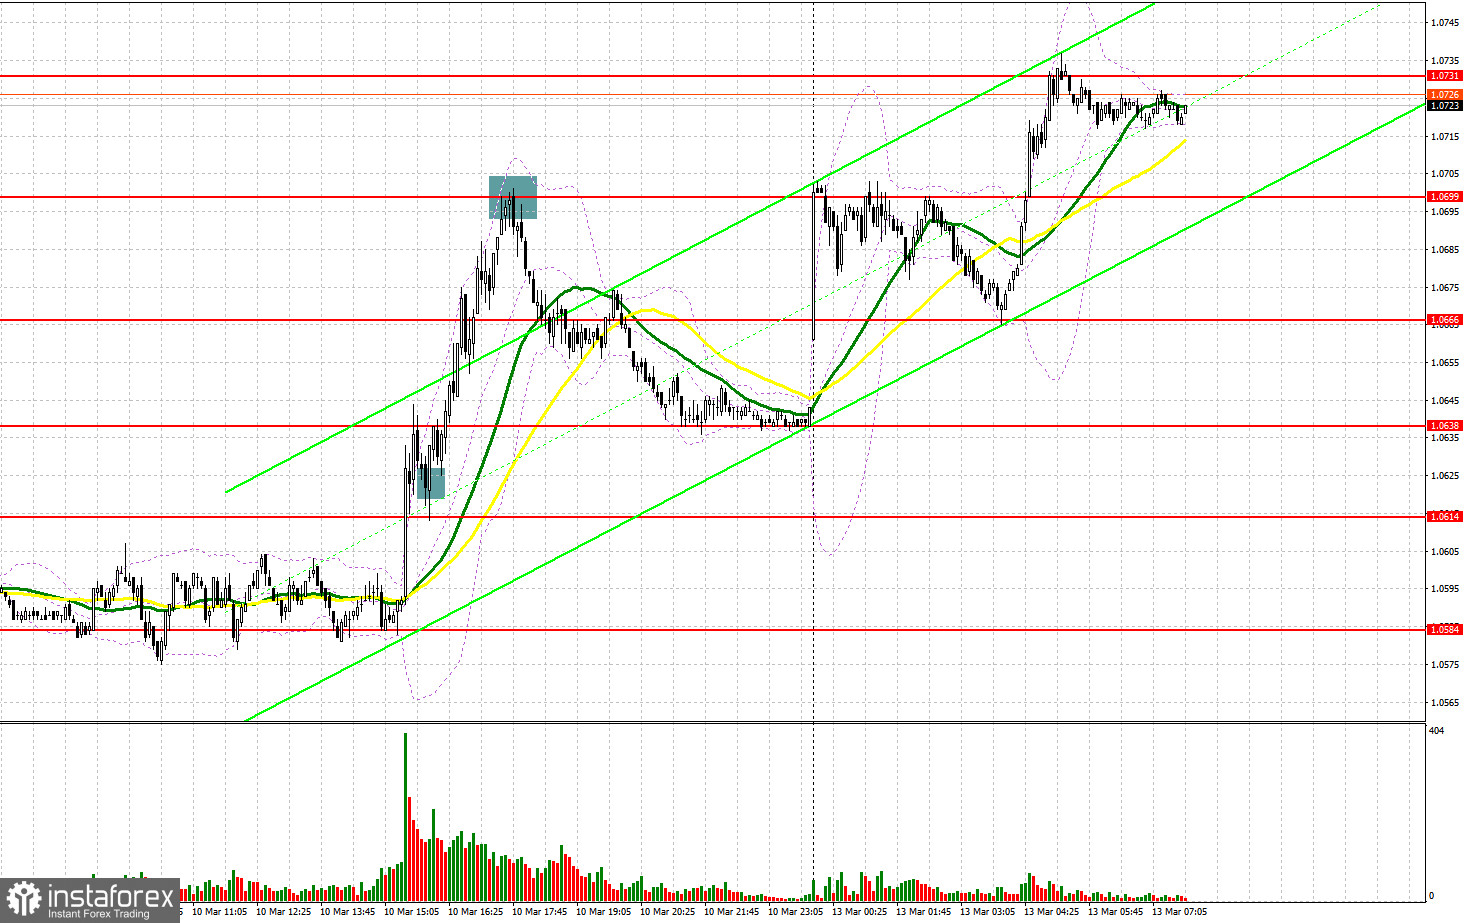
On Friday, traders received several signals to enter the market. Let us take a look at the 5-minute chart to clear up the market situation. Earlier, I asked you to pay attention to the level of 1.0598 to decide when to enter the market. A rise and a false breakout of this level led to a sell signal, which pushed the price down by 20 pips. However, the price failed to touch the target of 1.0574. In the second part of the day, a breakout and a test of 1.0614 led to a buy signal, which allowed the pair to climb by 80 pips. A sell order after a bounce off 1.0699, allowed traders to earn another 20 pips.
Conditions for opening long positions on EUR/USD:
A mixed report on the US labor market and a jump in the unemployment rate along with the problems in the banking sector led to a slump in the US dollar and a surge in the euro on Friday. Today, the euro continues gaining in value but the US regulator has managed to take the situation under control. It promised unlimited support to the SVB bank, which lost 2/3 of its capitalization in just a few days. Against the backdrop, traders received more reasons to buy the euro since the Fed is likely to revise its plans on the monetary policy tightening. Today, the macroeconomic calendar is empty. That is why we have to rely on technical factors. If the euro drops, buyers should protect the nearest support level of 1.0699, which acted as resistance on Friday. A false breakout of this level will give a buy signal with the target at the new resistance level of 1.0769. A breakout and a downward test of this level amid the absence of statistical data and expectations of monetary policy loosening by the Fed will form an additional buy signal with the target at 1.0800. There, bulls may face obstacles. A breakout of 1.0800 will affect bears' stop orders, thus giving one more long signal with the target t 1.0834, where it is better to lock in profits. If the euro/dollar pair declines and buyers fail to protect 1.0699, pressure on the pair will return. A breakout of this level will lead to a decline to the next support level of 1.0666. Only a false breakout of this level will give a buy signal. Traders may also go long just after a bounce off the low of 1.0638 or even lower – at 1.0614, expecting a rise of 30-35 pips within the day.
Conditions for opening short positions on EUR/USD:
Sellers have suffered losses since there are no reasons that may support the greenback. Now, bears should primarily protect the nearest support level of 1.0731. The price is expected to test this level in the first part of the day. A false breakout of this level will give a sell signal with the target at the nearest support level of 1.0699. A breakout and a reverse test of this level amid the absence of macroeconomic data will lead to the price correction, thus forming an additional short signal with the target at 1.0666. Notably, even if the predictions come true, the market sentiment will remain bullish. A settlement below 1.0666 will lead to a deeper drop to 1.0638, where it is better to lock in profits. If the euro/dollar pair increases during the European session and bears fail to protect 1.0731, which is more likely, it will be wise to avoid selling until the price hits 1.0769. There, traders may go short after an unsuccessful settlement. Traders may also initiate short orders just after a rebound from the high of 1.0800, expecting a decline of 30-35 pips.
COT report
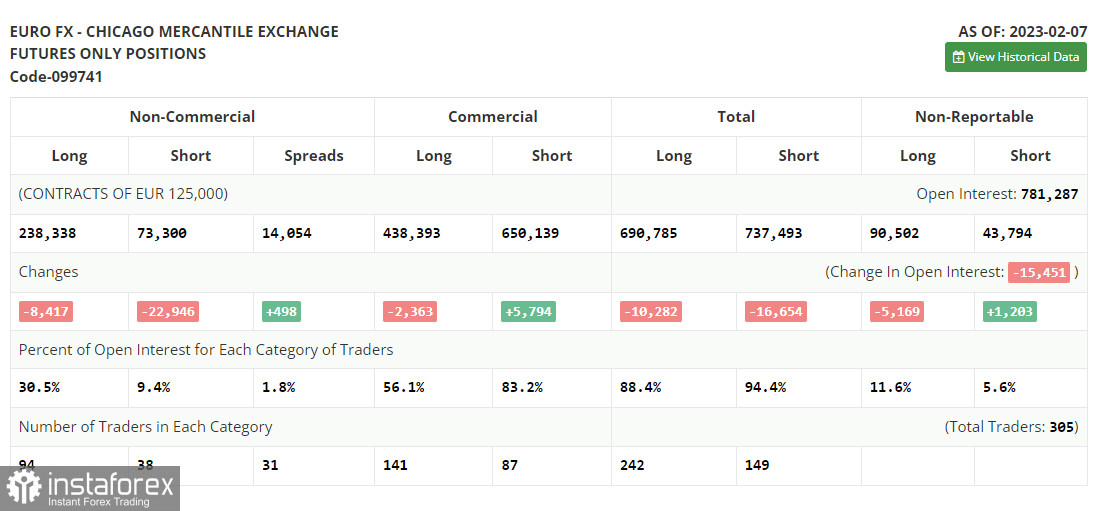
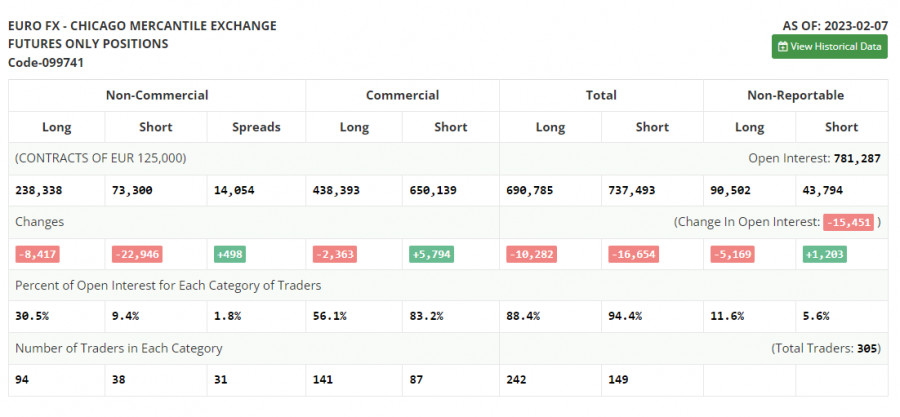
According to the COT report from February 7, the number of both long and short positions dropped. The COT report from February 7 logged a decrease in both long and short positions. This happened just after the Federal Reserve and the ECB announced their key rate decisions. In fact, the COT data from a month ago is of little interest at this point as it is not relevant due to the technical glitch the CFTC recently suffered. That is why we have to wait for fresh reports. In the near future, Fed Chair Jerome Powell will give testimony, which may determine the dollar's future trend for a month ahead. The FOMC meeting will take place at the end of March. Hawkish remarks about inflation and monetary policy will boost the US dollar against the euro. If Powell says nothing new on the matter, the greenback is likely to show weakness. According to the COT report, the number of long non-commercial positions decreased by 8,417 to 238,338. The number of short non-commercial positions slid by 22,946 to 73,300. Consequently, the non-commercial net position came in at 165,038 versus 150,509. The weekly closing price fell to 1.0742 from 1.0893.
Signals of indicators:
Moving Averages
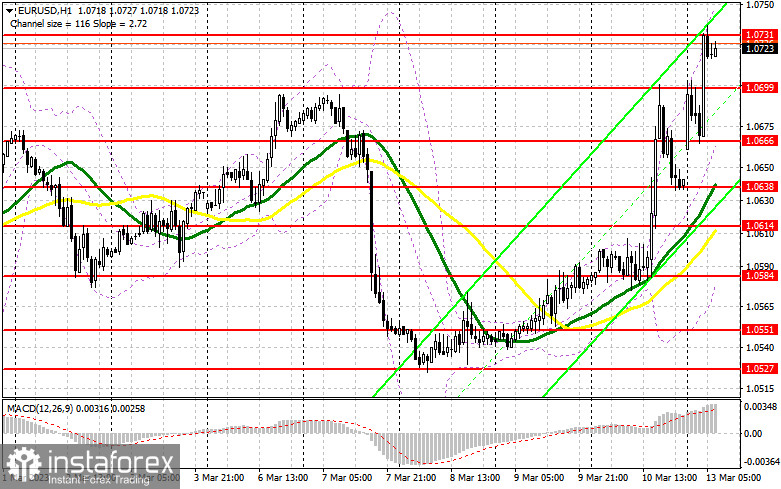
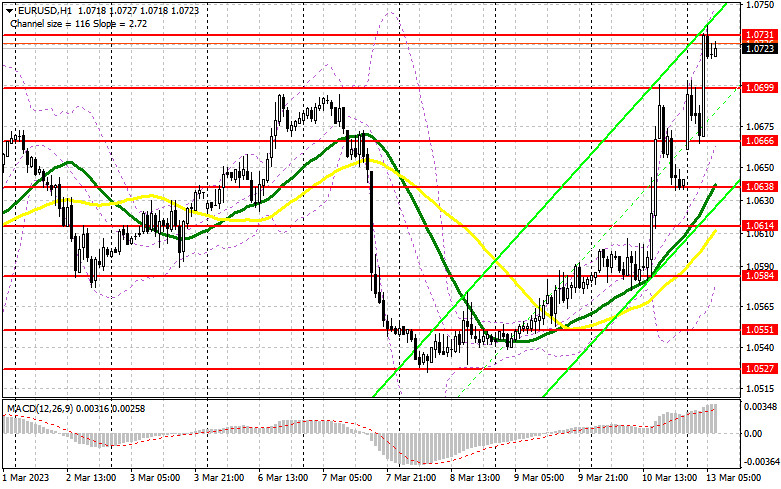
Trading is performed above the 30- and 50-day moving averages, which points to the bullish sentiment in the market.
Note: The author considers the period and prices of moving averages on the one-hour chart which differs from the general definition of the classic daily moving averages on the daily chart.
Bollinger Bands
In case of a decline, the lower limit of the indicator located at 1.0584 will act as support.
Description of indicators
- Moving average (a moving average determines the current trend by smoothing volatility and noise). The period is 50. It is marked in yellow on the chart.
- Moving average (a moving average determines the current trend by smoothing volatility and noise). The period is 30. It is marked in green on the graph.
- MACD indicator (Moving Average Convergence/Divergence - convergence/divergence of moving averages). A fast EMA period is 12. A slow EMA period is 26. The SMA period is 9.
- Bollinger Bands. The period is 20.
- Non-profit speculative traders are individual traders, hedge funds, and large institutions that use the futures market for speculative purposes and meet certain requirements.
- Long non-commercial positions are the total number of long positions opened by non-commercial traders.
- Short non-commercial positions are the total number of short positions opened by non-commercial traders.
- The total non-commercial net position is a difference in the number of short and long positions opened by non-commercial traders.