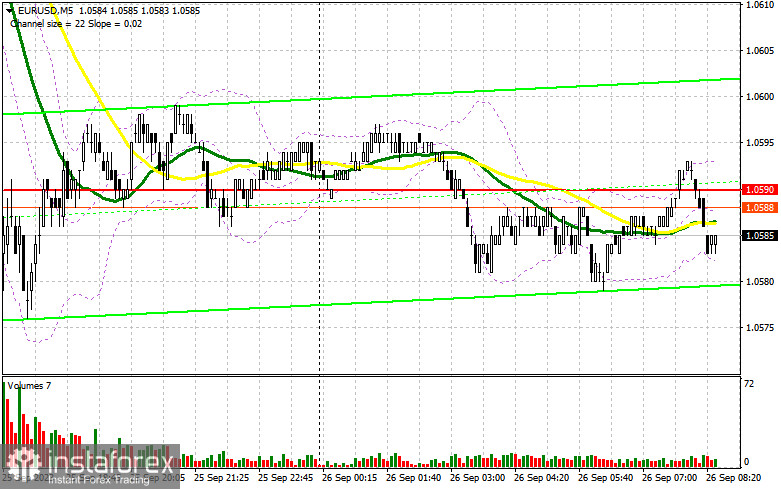
Yesterday, the pair formed just one entry signal. Let's have a look at what happened on the 5-minute chart. In my morning review, I mentioned the level of 1.0645 as a possible entry point. Its breakout and a retest generated a good entry signal into sell positions but after a 15-pip decline, the selling pressure on the pair eased. In the afternoon, the euro extended its slide but formed no more entry signals. The pressure increased following the statement by ECB President Christine Lagarde.
COT report
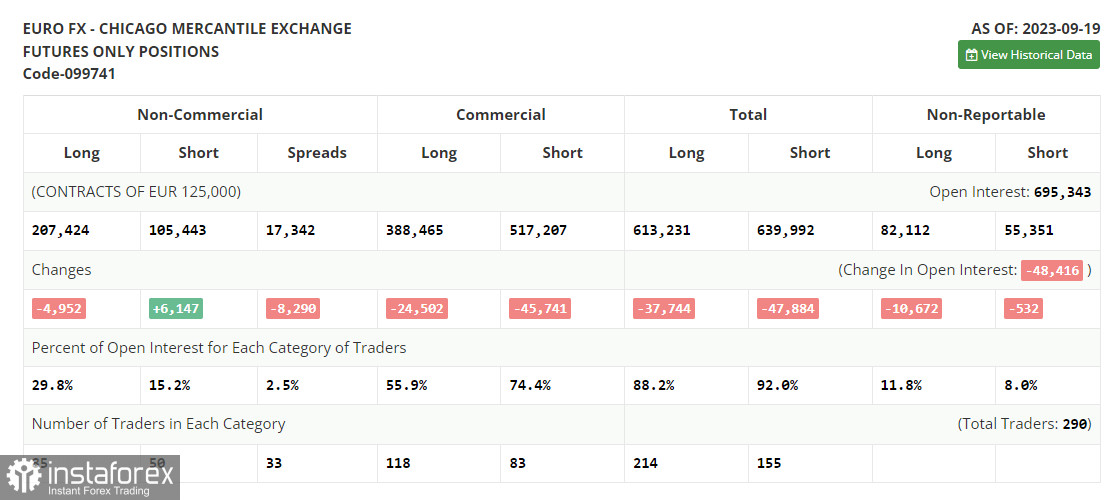
Before moving on to the EUR/USD forecast, let's first discuss the developments in the futures market and changes in the Commitments of Traders (COT). The COT report for September 19 showed a sharp decline in long positions and a rise in the short ones. Adverse shifts in the Eurozone's economic landscape and looming threats of further interest rate hikes by the European Central Bank (ECB) have bolstered the prevailing bearish sentiment. Interestingly, the euro did not find much respite even after the Federal Reserve decided to hold rates steady. However, it is worth noting that the Fed clearly communicated the possibility of another rate increase before the year ends. The COT report indicates that non-commercial long positions dipped by 4,952 to stand at 207,424. Conversely, non-commercial short positions saw an increase of 6,147, reaching a total of 105,443. As a result, the spread between long and short positions narrowed by 8,290 contracts. The closing price dropped to 1.0719 from 1.0736, further underscoring the bearish market sentiment for EUR/USD.
For long positions on EUR/USD
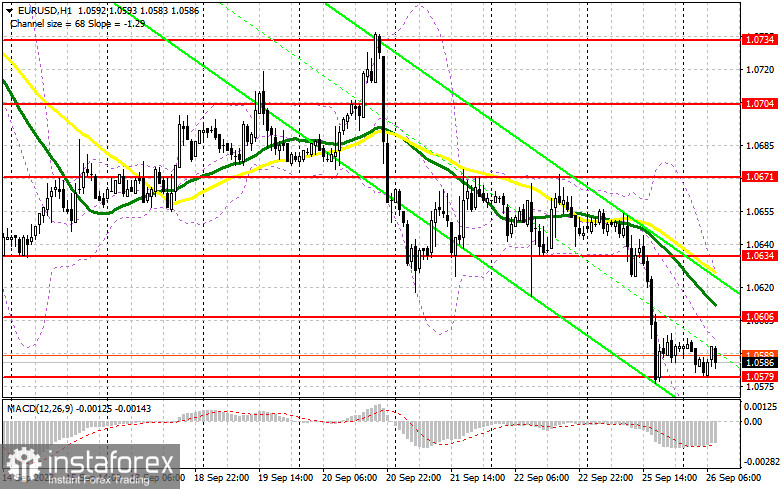
Yesterday's remarks by ECB President Christine Lagarde did not provide any support for the euro. Instead, they increased the downward pressure on the pair. Lagarde clearly indicated that high interest rates would persist for much longer than previously anticipated. Given the frailty of the European economy, this does not seem like an optimal decision for the Eurozone's future. With only an ECB Executive Board member, Philip Lane's speech on today's calendar, the euro might continue to weaken during the first half of the day, aiming for monthly lows. My action plan is to seek short opportunities for EUR/USD after forming a false breakout around the new support level of 1.0579 established yesterday. A continued divergence on the MACD indicator will be a confirmation of the right entry point for long positions, targeting a return to the resistance at 1.0606. Breaking and testing this range from above will bolster demand for the euro, providing an opportunity for a correction and a surge towards 1.0634, where the moving averages support bears. My ultimate target is the 1.0671 zone where I intend to take profits. If EUR/USD declines and there is no activity at 1.0579, bears will gain more control. Only a false breakout near 1.0549 will signal a buying opportunity. I will initiate long positions immediately on a rebound from 1.0520, aiming for an upward correction of 30-35 pips within the day.
For short positions on EUR/USD
Sellers assert their strength every time the euro rises, highlighting their presence in the market. If there is an upward move in EUR/USD, bears need to defend the new resistance at 1.0606 formed yesterday. A false breakout there will provide an entry point, targeting the low of 1.0579 which is also an intermediate support. Only after a breakout of this level and its upward retest will I look for another sell signal, aiming for 1.0549, where larger buyers might step in. My ultimate target will be the 1.0520 level where I will take profits. If EUR/USD moves up during the European session and bears are absent at 1.0606, bulls might attempt an upward correction. In this scenario, I will delay going short until the price hits the new resistance at 1.0634. I may consider selling there but only after a failed consolidation. I will immediately initiate short positions on a rebound from the 1.0671 high, aiming for a downward correction of 30-35 pips.
Indicator signals:
Moving Averages
Trading below the 30- and 50-day moving averages indicates a further downtrend in the pair.
Please note that the time period and levels of the moving averages are analyzed only for the H1 chart, which differs from the general definition of the classic daily moving averages on the D1 chart.
Bollinger Bands
If the pair declines, the lower band of the indicator at 1.0564 will act as support. In case of an upward movement, the upper band of the indicator at 1.0620 will serve as resistance.
Description of indicators:
• A moving average of a 50-day period determines the current trend by smoothing volatility and noise; marked in yellow on the chart;
• A moving average of a 30-day period determines the current trend by smoothing volatility and noise; marked in green on the chart;
• MACD Indicator (Moving Average Convergence/Divergence) Fast EMA with a 12-day period; Slow EMA with a 26-day period. SMA with a 9-day period;
• Bollinger Bands: 20-day period;
• Non-commercial traders are speculators such as individual traders, hedge funds, and large institutions who use the futures market for speculative purposes and meet certain requirements;
• Long non-commercial positions represent the total number of long positions opened by non-commercial traders;
• Short non-commercial positions represent the total number of short positions opened by non-commercial traders;
• The non-commercial net position is the difference between short and long positions of non-commercial traders.