empty
 
 
31.10.2022 07:14 AM
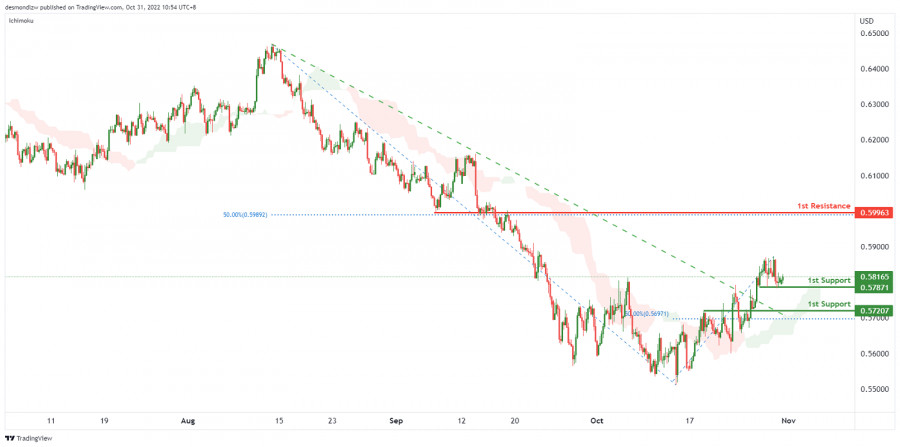
NZDUSD Potential for Bullish Rise | 31st October 2022

This image is no longer relevant

On the H4 chart, as the price is breaking the descending trendline and the price is above ichimoku cloud, we have a bullish bias that the price may rise from the 1st support at 0.57871, which is in line with the previous swing low to the 1st resistance at 0.59963, where the 50% fibonacci retracement is. Alternatively, the price may drop to the 1st support at 0.57207, where the previous swing low and 50% fibonacci retracement are.

Trading Recommendation

Entry: 0.57871

Reason for Entry:Previous swing low

Take Profit: 0.59963

Reason for Take Profit:

Overlap resistance and 50% fibonacci retracement

Stop Loss: 0.57207

Reason for Stop Loss:

Previous swing low and 50% fibonacci retracement

NZDUSD
New Zealand Dollar vs US Dollar
Select timeframe
5
min
15
min
30
min
1
hour
4
hours
1
day
1
week
Start trade
Start trade
WTI, H4 | Potential Reversal ?
WTI crude oil has been experiencing bearish momentum lately, potentially leading to a bearish reaction off the first resistance at 70.38 and a drop towards the first support at 67.02. The second support level at 64.36 is also expected to act as support due to its multi-swing low status. The first.
Author: Dean Leo
01:41 2023-03-22 UTC--4
1855
XAUUSD H4 | Potential Bullish Reversal?
There is a possibility of a bullish bounce for gold from the first support level at $1933, followed by a potential move towards the first resistance level at $1957. The $1933 level is an overlap support and is closely aligned with the 38.20% Fibonacci retracement, making it a robust support level..
Author: Dean Leo
01:39 2023-03-22 UTC--4
2125
USD/JPY, H4 | Break out trendline?
The USD/JPY chart currently reflects a bullish momentum as it is trading above a significant ascending trend line, indicating potential for further bullish movement. In case the price manages to break the 1st resistance level, it could advance towards the 2nd resistance level. The 1st support.
Author: Dean Leo
01:37 2023-03-22 UTC--4
1165
Show more
  • Grand Choice
    Contest by
    InstaForex
    InstaForex always strives to help you
    fulfill your biggest dreams.
    THAM GIA CUỘC THI
  • Tiền gửi lần truy cập
    Ký quỹ tài khoản của bạn với $3000 và nhận được $8000 nhiều hơn!
    Trong Tháng 3 chúng tôi xổ $8000 trong chiến dịch Chancy Deposit!
    Có được một cơ hội giành chiến thắng bằng việc ký quỹ $3000 vào một tài khoản giao dịch. Đáp ứng được điều kiện này, bạn trở thành một người tham gia chiến dịch.
    THAM GIA CUỘC THI
  • Giao dịch khôn ngoan, thành công
    Nạp tiền vào tài khoản của bạn với ít nhất $ 500, đăng ký cuộc thi và có cơ hội giành được các thiết bị di động.
    THAM GIA CUỘC THI
  • 100% tiền thưởng
    Cơ hội duy nhất của bạn để nhận 100% tiền thưởng khi gửi tiền
    NHẬN THƯỞNG
  • 55% Tiền thưởng
    Đăng ký tiền thưởng 55% cho mỗi lần gửi tiền của bạn
    NHẬN THƯỞNG
  • 30% tiền thưởng
    Nhận 30% tiền thưởng mỗi khi bạn nạp tiền vào tài khoản của mình
    NHẬN THƯỞNG

Recommended Stories

GBP/USD: imminent breakout and continuation

The GBP/USD pair continues to challenge the 1.2282 former high which represents an upside obstacle. You knew from my previous analysis that the price could resume its growth as long

Ralph Shedler 19:36 2023-03-22 UTC+2

EUR/USD challenging 1.0788 resistance

The EUR/USD pair extended its growth, registering a new high of 1.0800. Now, it is trading at 1.0791 at the time of writing. The bias is bullish, so further growth

Ralph Shedler 18:02 2023-03-22 UTC+2

Trading Signal for GBP/USD for March 22 - 23, 2023: key level 1.2217 (4/8 Murray - symmetrical triangle)

The key level is located around 1.2217 and around 1.2207. If the British pound breaks both levels and consolidates below the 4/8 Murray, we could expect a strong technical correction

Dimitrios Zappas 15:54 2023-03-22 UTC+2

Technical analysis on Gold for March 22nd, 2023.

Gold price is under pressure. Trend is still bullish as price continues trading inside the blue upward sloping channel. In the near term price is vulnerable to a pull back

Alexandros Yfantis 14:18 2023-03-22 UTC+2

Technical analysis on EURUSD for March 22nd, 2023.

EURUSD is trading around 1.0785. Short-term trend remains bullish a price continues making higher highs and higher lows. Price is inside the upward sloping blue channel and is approaching

Alexandros Yfantis 14:08 2023-03-22 UTC+2

USDJPY breaks out of bearish short-term channel.

USDJPY is trading around 132.82. As we explained in previous posts, USDJPY was very probable to produce a bounce higher as price stopped the decline at the 61.8% retracement level

Alexandros Yfantis 14:05 2023-03-22 UTC+2

March 22, 2023 : EUR/USD daily technical review and trading opportunities.

The market has remained under buying pressure until a plateau level occurred around 1.0800-1.0850. This was followed by a significant SELLING price action leading to the recent price decline

Mohamed Samy 13:20 2023-03-22 UTC+2

March 22, 2023 : EUR/USD Intraday technical analysis and trading plan.

Price action around the key-level of (1.0550-1.0600) was quite bullish. That's why, further bullish continuation towards 1.0800 was demonstrated. Moreover, more bullish advancement towards the nearest supply zone around 1.1150-1.1200

Mohamed Samy 13:18 2023-03-22 UTC+2

March 22, 2023 : GBP/USD Intraday technical analysis and significant key-levels.

Please take into consideration that bullish breakout above 1.2340 will probably enable further advancement towards 1.2700. However, the GBPUSD bulls failed to record a new high above 1.2200. Instead

Mohamed Samy 13:17 2023-03-22 UTC+2

Analysis of EUR/USD on March 22. EUR likely to decline after Fed meeting

Hi everyone! The EUR/USD pair rose above 1.0750 on Tuesday. It may approach 1.0861, the Fibonacci correction level of 200.0%. The upward corridor indicates a bullish sentiment. However

Samir Klishi 11:17 2023-03-22 UTC+2
Không thể nói chuyện ngay bây giờ?
Đặt câu hỏi của bạn trong phần trò chuyện.