empty
 
 
31.10.2022 07:14 AM
NZDUSD Potential for Bullish Rise | 31st October 2022

This image is no longer relevant

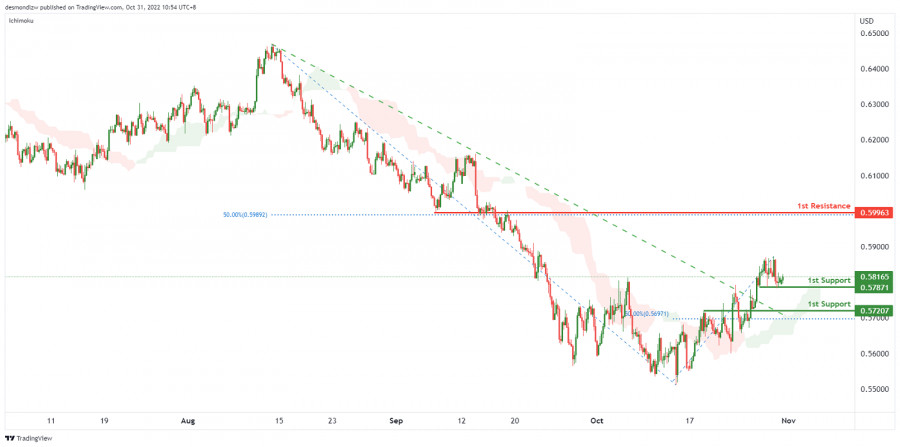
On the H4 chart, as the price is breaking the descending trendline and the price is above ichimoku cloud, we have a bullish bias that the price may rise from the 1st support at 0.57871, which is in line with the previous swing low to the 1st resistance at 0.59963, where the 50% fibonacci retracement is. Alternatively, the price may drop to the 1st support at 0.57207, where the previous swing low and 50% fibonacci retracement are.

Trading Recommendation

Entry: 0.57871

Reason for Entry:Previous swing low

Take Profit: 0.59963

Reason for Take Profit:

Overlap resistance and 50% fibonacci retracement

Stop Loss: 0.57207

Reason for Stop Loss:

Previous swing low and 50% fibonacci retracement

Dean Leo,
Analytical expert of InstaForex
© 2007-2023
NZDUSD
New Zealand Dollar vs US Dollar
Select timeframe
5
min
15
min
30
min
1
hour
4
hours
1
day
1
week
Start trade
Start trade
XAUUSD, Day | Potential Reversal from a key level ?
The XAU/USD chart currently has bearish momentum, with potential for a drop towards the first support level at 1948, an overlap support level. If prices continue to fall, they could test the second support level at 1881, another overlap support level and the 61.80% Fibonacci retracement level. The.
Author: Dean Leo
01:49 2023-03-27 UTC--4
1105
XAUUSD, Day | Continue to 1st Support?
BTC/USD chart shows bearish momentum with potential for drop to first support level. Overall, Bitcoin's momentum against the US dollar is bearish, suggesting possible further price decline. A bearish reaction from the first resistance level could lead to a drop towards the first support level at.
Author: Dean Leo
01:48 2023-03-27 UTC--4
1075
WIT(OIL), Day | Strong descending trendline ?
WTI oil prices have turned bearish as they fell below a crucial support level. The chart indicates that the momentum has shifted to the downside, signaling a potential further decline in prices. Consequently, the overall bias for WTI oil prices is now bearish. In the near term, prices could.
Author: Dean Leo
01:46 2023-03-27 UTC--4
1030
Show more
  • Grand Choice
    Contest by
    InstaForex
    InstaForex always strives to help you
    fulfill your biggest dreams.
    JOIN CONTEST
  • Chancy Deposit
    Deposit your account with $3,000 and get $8000 more!
    In March we raffle $8000 within the Chancy Deposit campaign!
    Get a chance to win by depositing $3,000 to a trading account. Having fulfilled this condition, you become a campaign participant.
    JOIN CONTEST
  • Trade Wise, Win Device
    Top up your account with at least $500, sign up for the contest, and get a chance to win mobile devices.
    JOIN CONTEST
  • 100% Bonus
    Your unique opportunity to get a 100% bonus on your deposit
    GET BONUS
  • 55% Bonus
    Apply for a 55% bonus on your every deposit
    GET BONUS
  • 30% Bonus
    Receive a 30% bonus every time you top up your account
    GET BONUS

Recommended Stories

XAUUSD, Day | Potential Reversal from a key level ?

The XAU/USD chart currently has bearish momentum, with potential for a drop towards the first support level at 1948, an overlap support level. If prices continue to fall, they could

Dean Leo 07:49 2023-03-27 UTC+2

XAUUSD, Day | Continue to 1st Support?

BTC/USD chart shows bearish momentum with potential for drop to first support level. Overall, Bitcoin's momentum against the US dollar is bearish, suggesting possible further price decline. A bearish reaction

Dean Leo 07:48 2023-03-27 UTC+2

Technical Analysis of Daily Price Movement of United States Dollar Currency index, Monday March 27 2023.

If we look on the daily chart of USD index, then there will be a few interesting things: 1. There is a deviation between price movement with Awesome Oscillator indicator

Arief Makmur 06:23 2023-03-27 UTC+2

Technical Analysis of Daily Price Movement Gold Commodity Asset, Monday March 27 2023.

On the daily chart, Gold commodity asset seems appear after broken below the level of 1959,23. Gold will return corrected below where this things confirmed by: 1. The Appearance

Arief Makmur 06:23 2023-03-27 UTC+2

Trading Signal for GBP/USD for March 27 - 28, 2023: buy above 1.2207 (4/8 Murray - 21 SMA)

The key level is located at 1.2207 and could offer recovery of the pair above this area in the next few hours. In case the British pound falls below this

Dimitrios Zappas 05:45 2023-03-27 UTC+2

Forecast for EUR/USD on March 27, 2023

The euro closed Friday with a 71-point drop. The price tried to get out of the target range of 1.0758/87, but it still ended the day within that range

Laurie Bailey 04:45 2023-03-27 UTC+2

Forecast for GBP/USD on March 27, 2023

The British pound fell by 55 points on Friday, breaking the support of the MACD indicator line. The price showed that the last two breakthroughs above this line on Wednesday

Laurie Bailey 04:45 2023-03-27 UTC+2

Forecast for AUD/USD on March 27, 2023

After the Australian dollar failed to break through the resistance at 0.6730 on March 22 and 23, it attacked the support at 0.6640 on Friday, March 24 . The Marlin

Laurie Bailey 04:45 2023-03-27 UTC+2

Technical analysis of GBP/USD for March 26, 2023

The GBP/USD pair broke resistance at 1.2135 which turned into strong support yesterday. This level coincides with 38.2% of Fibonacci retracement which is expected to act as major support today

Mourad El Keddani 22:42 2023-03-26 UTC+2

Technical analysis of EUR/USD for March 26, 2023

The EUR/USD pair rallied upwards strongly yesterday to breach the bearish channel's resistance and settles above it, opening the way to turn to the upside on the intraday and short-term

Mourad El Keddani 22:36 2023-03-26 UTC+2
Can't speak right now?
Ask your question in the chat.