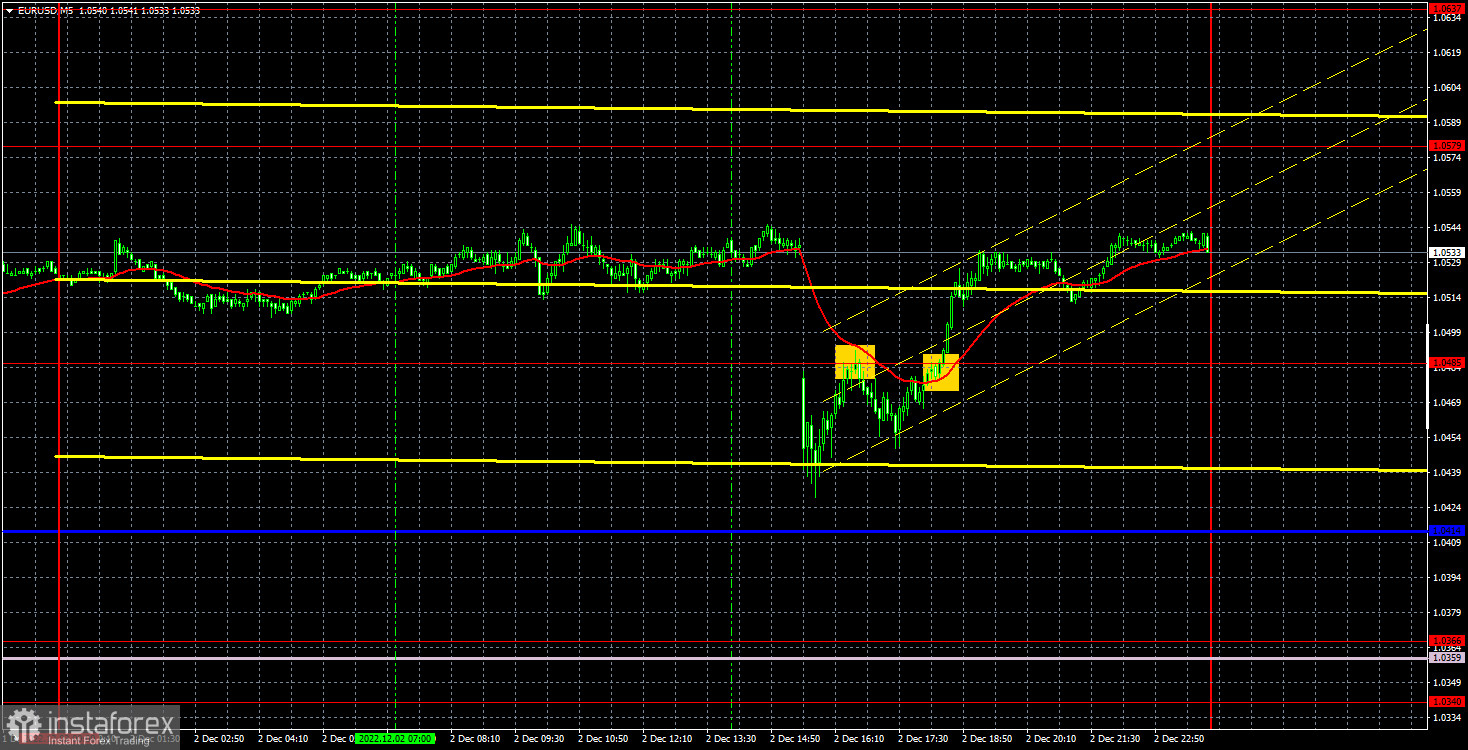
M5 chart of EUR/USD
On Friday, EUR/USD went upwards again by the end of the day. This time the overall growth was not so strong since important reports were published in America, which were definitely in favor of the US dollar. The greenback grew for a while after the reports, but in the evening the euro started rising again and offset all the losses after the US data. If the dollar grew quite naturally after the Non-farms and the unemployment, then the euro's subsequent growth raised some questions. However, we could get used to this situation. The euro has been growing for quite a long time without any particular reason, so we have only to work out these trends and quite volatile movements. Separately, the macroeconomic statistics from across the ocean was quite strong, so the market should have been selling the pair, not buying it.
The pair generated unfortunate signals on Friday. Before the US reports were released the pair was in a flat, and after it EUR/USD plunged so fast that there was no chance to work out this movement. That is why the first signal appeared in the middle of the US trading session, when the price rebounded from 1.0485. After that the pair went down about 35 pips, so traders could place the Stop Loss to Breakeven. The next buy signal was near the same level of 1.0485, but it appeared too late, so traders could not use it. But if some traders opened a long position, they definitely made a profit.
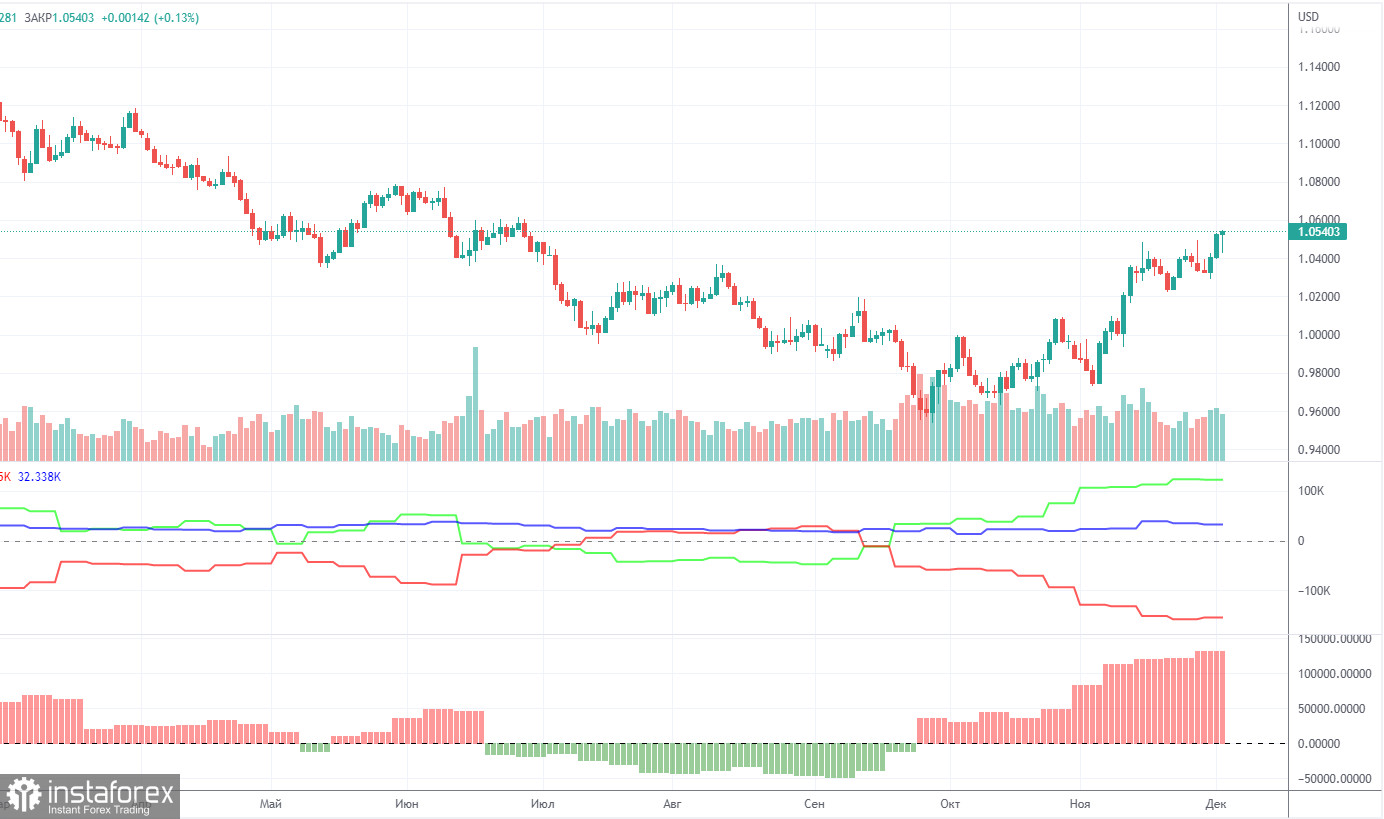
COT report
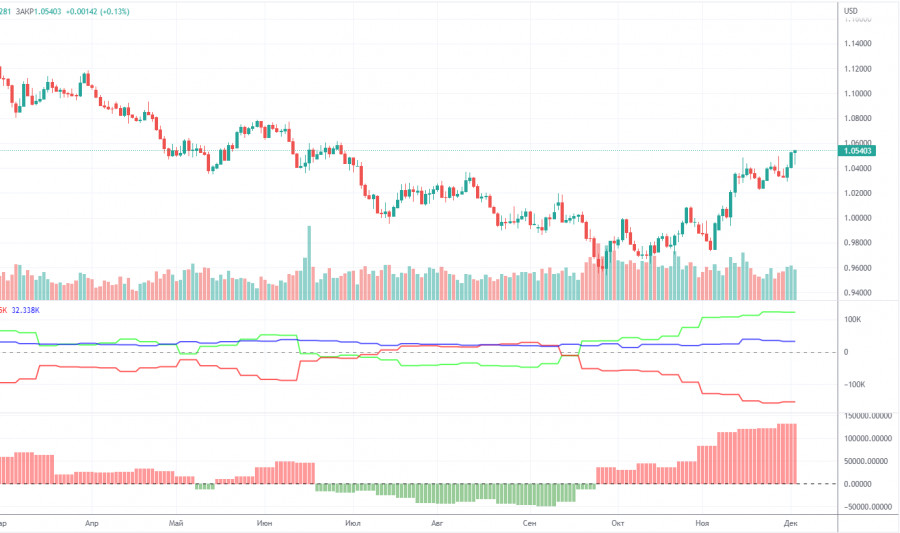
COT reports on EUR/USD have puzzled traders through most of 2022. Half of the year, COT reports indicated clear-cut bullish sentiment among large market makers while the single European currency was extending its weakness. For a few months, the reports showed a bearish sentiment and the euro was also trading lower. Now sentiment of non-commercial traders is turning bullish again, and the euro is rising, but it is a rather high net position that allows us to assume that the upward movement will end soon. During the reporting week, the number of Buy contracts for the Non-commercial group increased by 4,700, and the number of short contracts rose by 4,600. Accordingly, the net position grew by about 100 contracts. The European currency has been rising in recent weeks, which is already in line with the readings of the COT reports. At the same time, we believe that the US currency may still regain its footing amid the same geopolitics or due to the lack of fundamentals for further growth of the euro. The green and red lines of the first indicator moved far away from each other, which could mean the end of the uptrend (!!!) (which, in fact, never happened).
The number of BUY contracts is higher than the number of SELL contracts for non-commercial traders by 133,000. Thus, the net position of the "non-commercial" group may continue to rise further, but this may not trigger a similar rise in the euro. If we look at the overall numbers of open long and short contracts for all categories of traders, there are 33,000 more sell contracts (755,000 vs. 723,000).
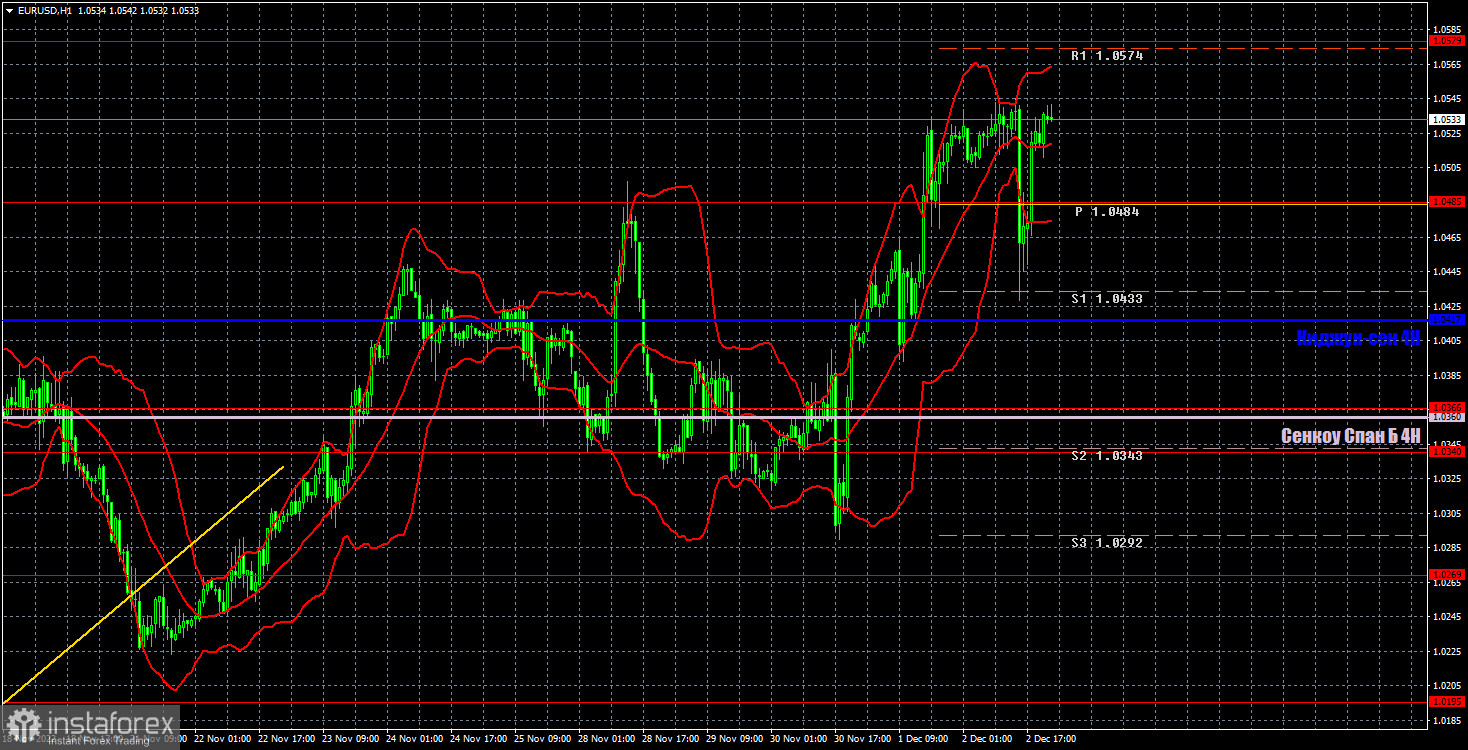
H1 chart of EUR/USD
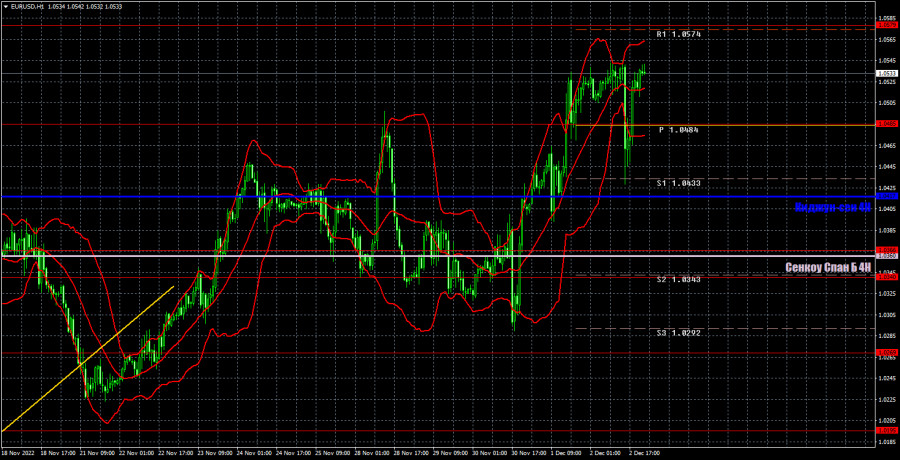
On the one-hour chart, EUR/USD continues to show absolutely erratic movements and Friday was just another proof of this. After the ascending trend line was broken, the downward movement did not start. After Federal Reserve Chairman Jerome Powell's speech, the pair returned to its local peaks for absolutely no reason and then it did not even fall after the strong US data. Therefore, movements can only be analyzed using technique. On Monday, the pair may trade at the following levels: 1.0195, 1.0269, 1.0340-1.0366, 1.0485, 1.0579, 1.0637, and also Senkou Span B (1.0359) and Kijun Sen (1.0414). Lines of the Ichimoku indicator may move during the day, which should be taken into account when determining trading signals. There are also support and resistance levels, but signals are not formed near these levels. Bounces and breakouts of the extreme levels and lines could act as signals. Don't forget about stop-loss orders, if the price covers 15 pips in the right direction. This will prevent you from losses in case of a false signal. On December 1, the EU will publish retail sales and business activity reports in the service sector. In America, the ISM Services Business Activity Index will be released, which is the most important report of the day.
What we see on the trading charts:
Price levels of support and resistance are thick red lines, near which the movement may end. They do not provide trading signals.
The Kijun-sen and Senkou Span B lines are the lines of the Ichimoku indicator, moved to the one-hour chart from the 4-hour one. They are strong lines.
Extreme levels are thin red lines from which the price bounced earlier. They provide trading signals.
Yellow lines are trend lines, trend channels, and any other technical patterns.
Indicator 1 on the COT charts reflects the net position size of each category of traders.
Indicator 2 on the COT charts reflects the net position size for the non-commercial group.