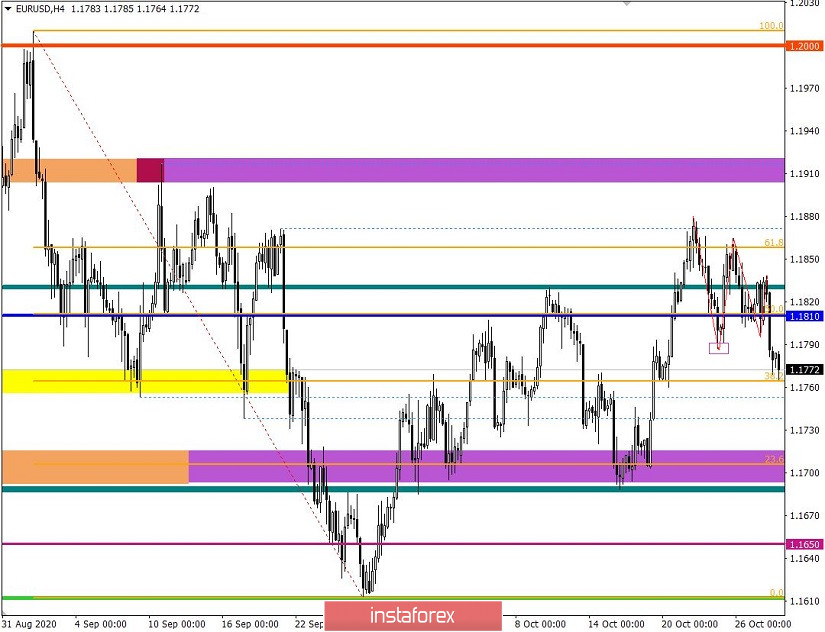
The EUR/USD pair managed to complete the formation of the zigzag-pattern yesterday by breaking its lower limit at 1.1787. Due to this, sellers had another chance for a recovery process relative to the four-week growth 1.1612 ---> 1.1880.
The recovery signal is quite strong, but do not forget that the market, as before, has a strong information background from hot topics: COVID, Brexit and the US presidential election. Thus, the speculative excitement caused by the surge of information can disrupt the clock component of technical analysis.
If we look into yesterday's fifteen-minute time frame, it can be observed that the main round of short positions declined from 17:30 to 21:00 in the evening, which resulted in a break down of the level of 1.1810 and the local low of 1.1787.
In terms of daily dynamics, an indicator of 57 points was recorded yesterday, which repeats the dynamics of October 26. The only important difference is the high coefficient of speculative deals, which caused a local activity surge.
It was discussed in the past analytical review that speculators viewed the completion of the zigzag pattern as a signal of an upcoming acceleration, which occurred in the market when the level of 1.1787 was broken.
Looking at the trading chart in general terms (daily period), it is clear that the basis is the upward price movement from September 28, which returned the quote to the limits of the previously passed side channel. The current movement is still in the structure of the ascending period of 1.1612 - - - > 1.1880, but there is a signal of an assumed recovery, which can set a downward interest in the market.
Yesterday's news background contained data on the volume of orders for durable goods in the United States, which has a forecasted growth of 0.4%, but as a result, they got an acceleration by as much as 1.9%.
US positive statistics in terms of the foundation plays in favor of the US dollar, but currently, the information background is in the lead.
Here, the coronavirus leaves no chance for economic recovery. There are new statistics on the number of confirmed cases of COVID-19 in Europe, which are breaking new records. One by one, EU countries are introducing tightening measures that are likely to take a while. The media, in turn, is full of headlines for a new lockdown.
So, German Chancellor, Angela Merkel, is making a warning due to the second wave of COVID-19, where discussions are in process on the possible closure of bars, cafes, restaurants, as well as holding public events.
Merkel's proposal will be discussed today (October 28) during regular meetings with the heads of the regions.
As we can see from the above material, the lever to weaken the Euro was, and is still on the market.
For the economic calendar, we do not have extra important statistics for Europe and the United States today. Market participants are focused on the information background, as well as on the upcoming meeting of the European Central Bank.
Further development
Analyzing the current trading chart, it can be seen that the quote is still holding at the coordinate 1.1770, which is considered a good signal for a downward development in terms of the recovery process. The next round of short positions is expected after price consolidation below the level of 1.1760, with the prospect of moving to 1.1700.
At the same time, the lack of price consolidation below 1.1760 may lead to temporary turbulence in the range of 1.1760/1.1795.
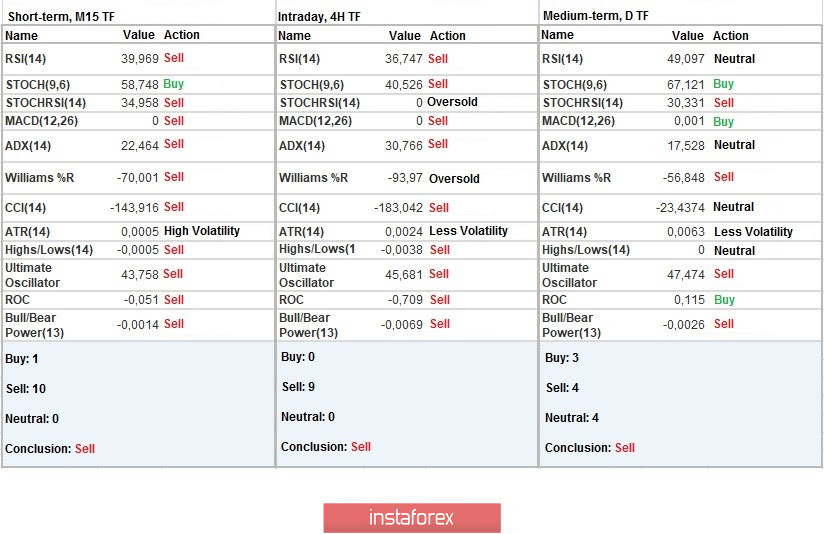
Indicator analysis
Analyzing different sectors of time frames (TF), it can be seen that the technical indicators on minute and hourly TFs have a sell signal due to a rapid decline yesterday and keeping quotes within the level of 1.1770. In turn, the daily TF changed the ascending signal to the descending one, due to the recovery process, as well as price consolidation below the zigzag-shaped pattern.
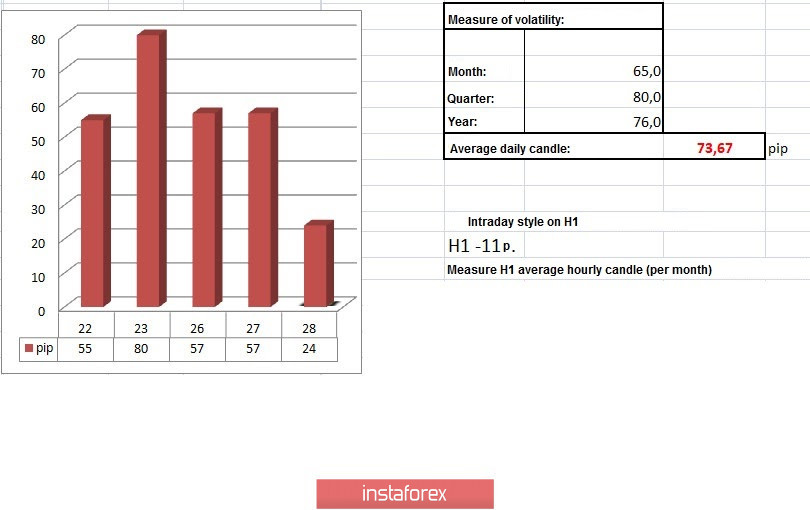
Weekly volatility / Volatility measurement: Month; Quarter; Year
The volatility measurement reflects the average daily fluctuations, calculated per Month / Quarter / Year.
The volatility of the current time is 24 pips, which is even 67% below the average. If there will be another surge in the information background regarding hot topics, local speculative price jumps are not excluded.
Key levels
Resistance zones: 1.1880; 1.1910; 1.2000 ***; 1.2100 *; 1.2450 **; 1.2550; 1.2825.
Support zones: 1.1700 1.1650 *; 1.1500; 1.1350; 1.1250 *; 1.1180 **; 1.1080; 1.1000 ***.
* Periodic level
** Range level
*** Psychological level