Good day, dear traders!
In this review, we will look at the technical picture of the AUD/USD currency pair, based on which we will try to find options for opening positions. Australia received extremely few statistics this week, and the ones that came out were worse than the forecasts. Thus, the fundamental background that can influence the price dynamics of the pair will come from the United States. A fairly impressive block of data from the US is expected today. All details can be seen in the economic calendar.
In general, it should be noted that in conditions of risk aversion, all commodity currencies are under pressure this week. However, this is not so clear, and this can be seen by looking at the price charts.
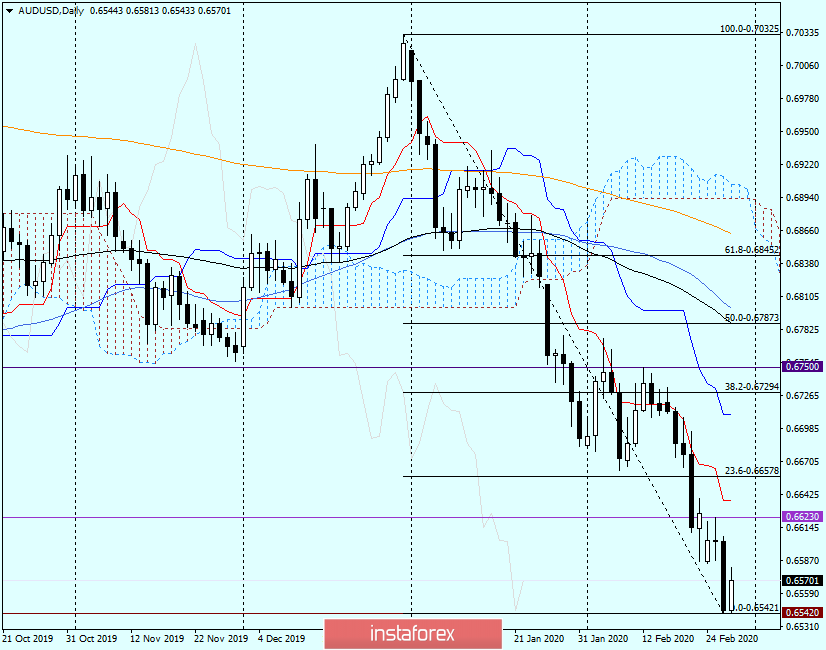
Daily
At yesterday's auction, the "Australian" once again declined. However, before that, there was a correction in a relatively narrow sideways range. But yesterday, the bears got down to business and reminded who is the owner of the AUD/USD market.
It would seem that today we could expect a continuation of the renewed downward scenario, however, this is not happening. At the time of writing, "Aussie" is showing growth. Good support for the quote was provided by the level of 0.6542, which is where the pair turned to a corrective rise and is trading near 0.6577.
If the upward movement continues, its nearest target will be the price zone of 0.6623-0.6638, where the trading highs are on February 25 and the Tenkan line of the Ichimoku indicator. If this area is passed, the pair will rise to the level of 23.6 Fibo from the decrease of 0.7032-0.6542, and the Kijun line, which passes at the level of 0.6710, may become an even longer target of the beginning of the corrective recovery. However, this is quite far from current prices, and it is unclear whether the correction will continue or be limited to a slight rebound from 0.6542.
By the way, the breakdown of this level signals the end of the rebound and the continuation of the downward trend. In this case, the immediate goal will be the psychological level of 0.6500, the passage of which will continue and strengthen the downward dynamics of the AUD/USD pair.
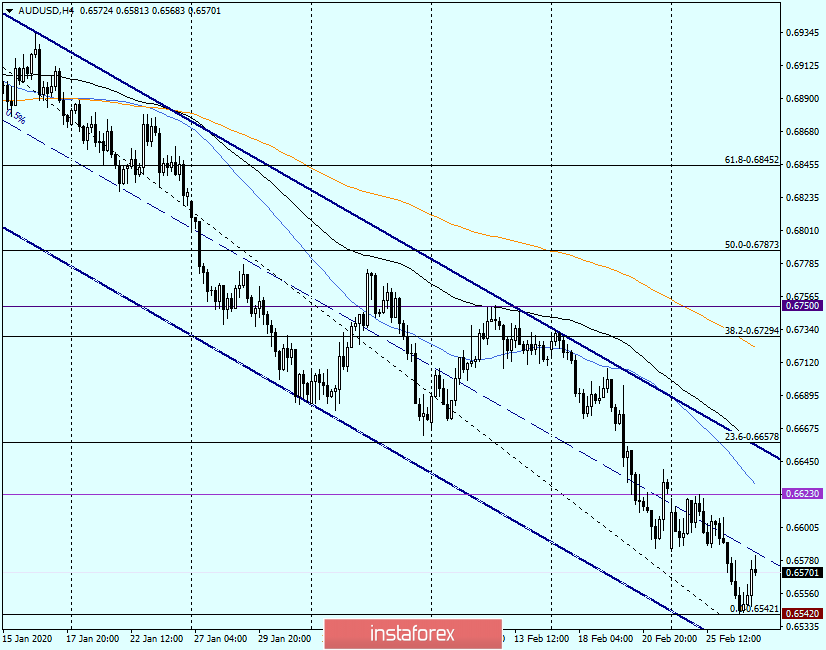
H4
The 4-hour chart clearly shows a bearish trend and a descending channel in which the pair is trading. At the same time, the "Australian" is located in the lower part of this channel, however, it is not possible to gain a foothold above its middle line (dotted).
I have repeatedly paid attention to the middle line of channels, because it often provides support or resistance to the price. In the current situation, the middle line resists, but if the bulls on the "Aussie" manage to break through it and gain a foothold higher, then the support function can already move to the middle line. With this development, you can try to buy AUD/USD with the goals of 0.6623, 0.6630 and 0.6665, where the upper border of the channel passes, and the 89-exponential moving average is located. In my opinion, this will be a good option for sales. First, the position is on the trend and will be opened after a corrective pullback. Secondly, the channel's resistance line together with the 89 EMA is quite capable of returning the quote to its main downward movement. The question is whether the bulls on the pair will be able to raise the rate to 0.6665.
Since the middle line of the channel does not allow the price to go up, you can try selling the Australian currency aggressively and risky right now. For some reason, there is little faith in a full-fledged deep correction, the bearish trend for AUD/USD is too strong. It is less risky to sell when the pair is not fixed above the middle line of the channel from the levels of 0.6620 and 0.6630.
Finally, the most attractive price zone for opening short positions will be 0.6700-0.6722, where there is a significant technical level and 200 exponential moving average.
For purchases, there are no options yet. Although, if the pair does not lose its upward direction before the end of the weekly trading, the weekly candle may form as a reversal. However, this is a completely different story.
Good luck!