Bitcoin is rather volatile due to an increase in the Take Profit orders of whales and the panic of retail investors. The BTC price tried to hold at the $60.2k level but it resumed decline. As of 17:15, BTC is trading below the $60k level, dropping lower. BTC is likely to test $58.7k for the third time. It may be the final attempt. So, it is likely to break below the support level. In order to determine the further price movement, it is necessary to conduct a technical analysis of the charts.
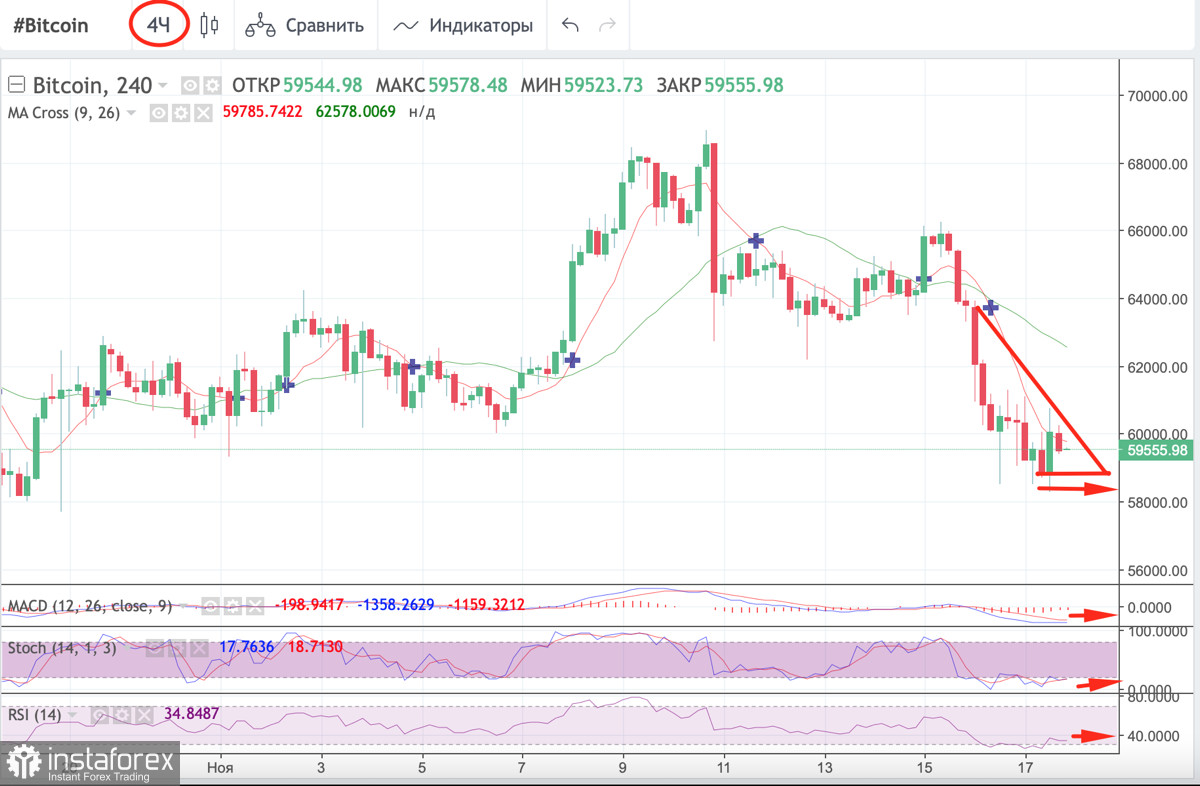
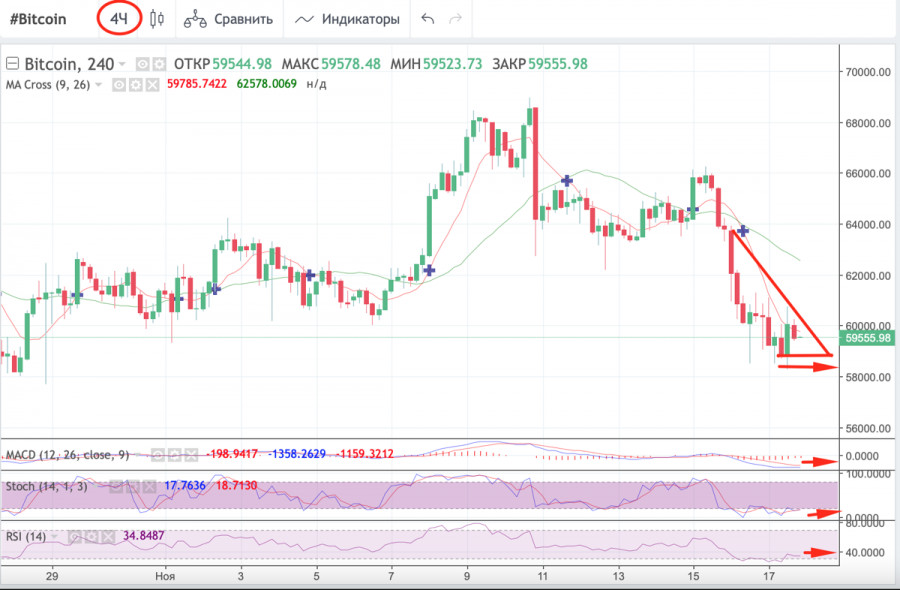
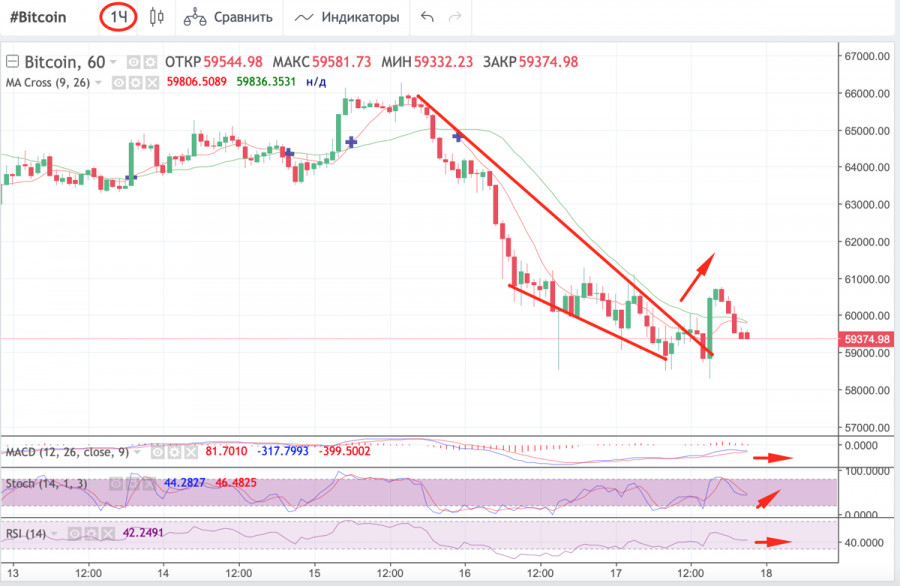
On the 4H chart, bitcoin keeps declining. The price slowed down around the $59.5k mark, which indicates the strengthening of bullish momentum the short-term weakness of bears. Technical indicators also signal a gradual reversal and the completion of the downward movement. Bulls may regain ground after the price approaches an important support level of $58.7k. At the same time, the MACD indicator is moving sideways, below the zero mark. It may signal a trend reversal, but this requires the formation of a bullish intersection or the beginning of an upward movement. Stochastic and the RSI indicators show a similar dynamic, moving near the 40 mark. traders seem to have priced in the drop below $60k. However, to make sure that a trend reversal may occur, it is necessary to analyze small timeframes.
Consolidation is the period when a certain cryptocurrency is located within a narrow horizontal price channel. Usually, it indicates price stabilization or weakness of the trend (bullish or bearish).
The Relative Strength Index (RSI) is a technical indicator that allows traders to determine the strength of a trend (descending or ascending) and find out possible changes in the price movement. Thanks to this indicator, it is possible to determine whether an asset is overbought or oversold. The appropriate level for this chart is 60 if we need a bullish trend. It indicates a high demand for the coin and the strength of the current upward momentum. When crossing this mark, the coin begins to move towards the overbought zone.
MACD (index of convergence/divergence of moving averages) is an indicator that allows traders to identify the trend based on the movement of moving averages and find metric values between them. The bullish signal is the intersection of the white line under the red and bearish. When the white line from above crosses the red, it indicates a downward movement.
Stochastic (stochastic oscillator) indicates the strength of the momentum of the current prevailing trend. If the indicator is above the 80 mark, then the asset can be considered overbought. If the stochastic is below 20, then an asset is oversold.
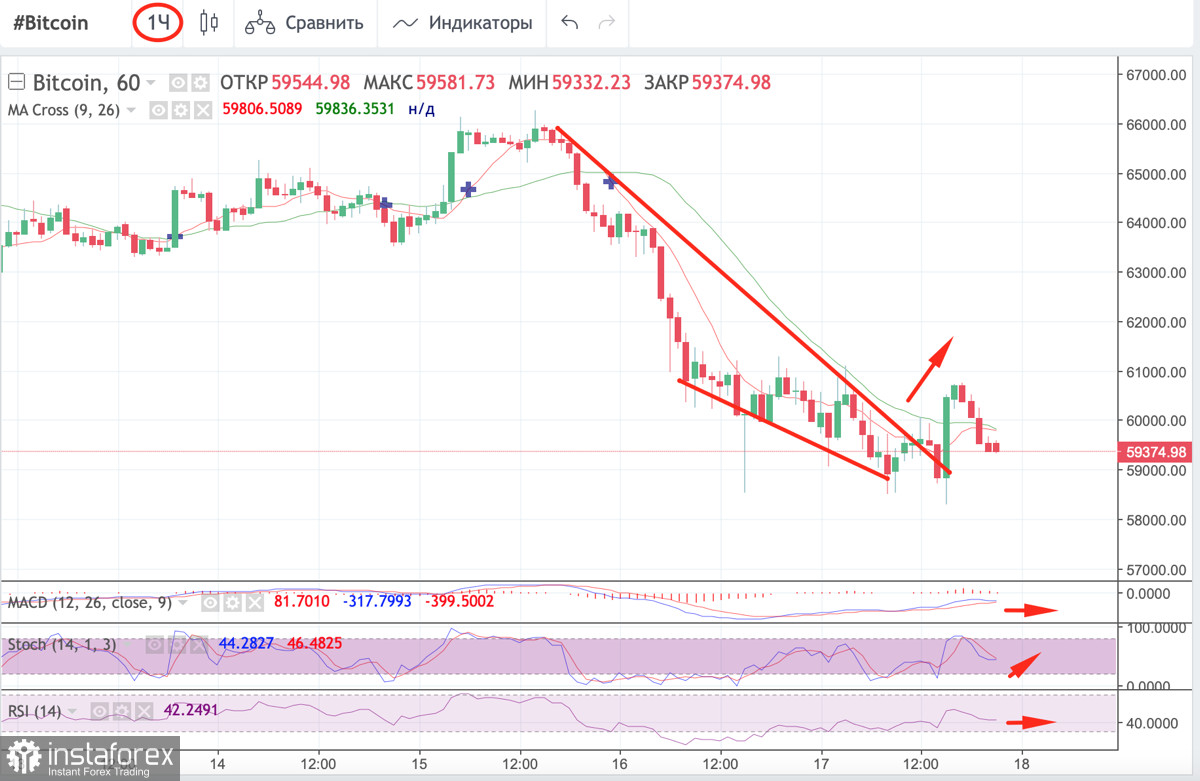
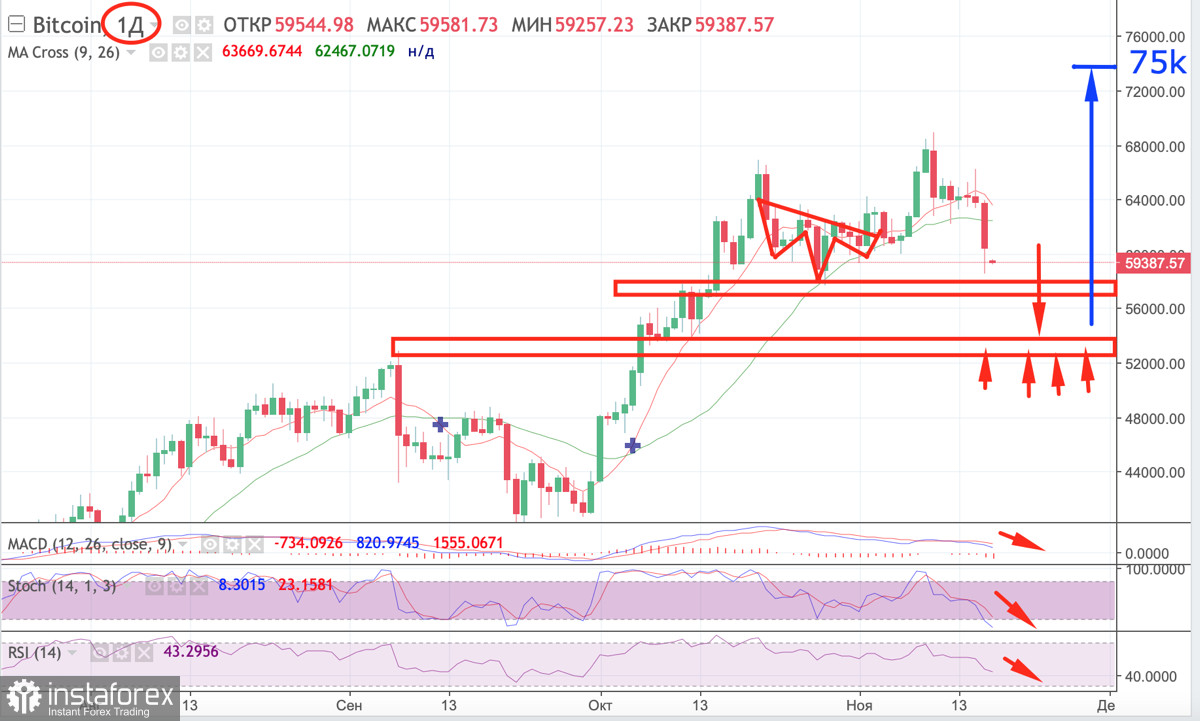
The D1 chart shows signs of the completion of the short-term downward momentum, which pushed the price below $60k. After the formation of a bullish candlestick, bears dominated the market. Yet, the size of the candlestick indicates that the downward movement is fading. In addition, the head and shoulders pattern has already been formed on the 1H chart, signaling a trend reversal. However, until the pattern is completed, it is impossible to confirm a reversal of the price movement. At the same time, the stochastic oscillator is close to forming a bullish intersection, indicating the development of short-term upward momentum. The RSI and the MACD indicators continue to move sideways. Judging by the 1H and 4H four-hour charts, bulls are trying to erase losses. However, it is possible to assess the strength of the short-term uptrend only by looking at the D1 chart.
On the 1D chart, the bias still remains bearish, signaling the breakout of the $58.6k zone and a further decline to the range of $53.5k-$57.8k. A rebound is likely to occur in this zone. In order to identify a reversal level, it is necessary to wait for a decline in this range and carefully monitor the charts and technical indicators. It may help find out the support level where a rebound may happen. Impoertantly, only small timeframes signal a trend reversal. If BTC breaks through $58.6k, it is recommended to open short positions and place a Stop Loss order near this level. Traders should closely monitor the price movement on smaller timeframes as a medium-term trend may trigger a rebound from the support level.