The GBP/USD currency pair turned downward on Thursday and began to correct. Even the inertial and unfounded growth we have observed in recent months cannot last forever. The British pound has exceeded its "correction plan" by one and a half times. Evidently, each subsequent price peak was only slightly higher than the previous one, and the upward momentum was weakening. Thus, we still expect a strong decline from the pair.
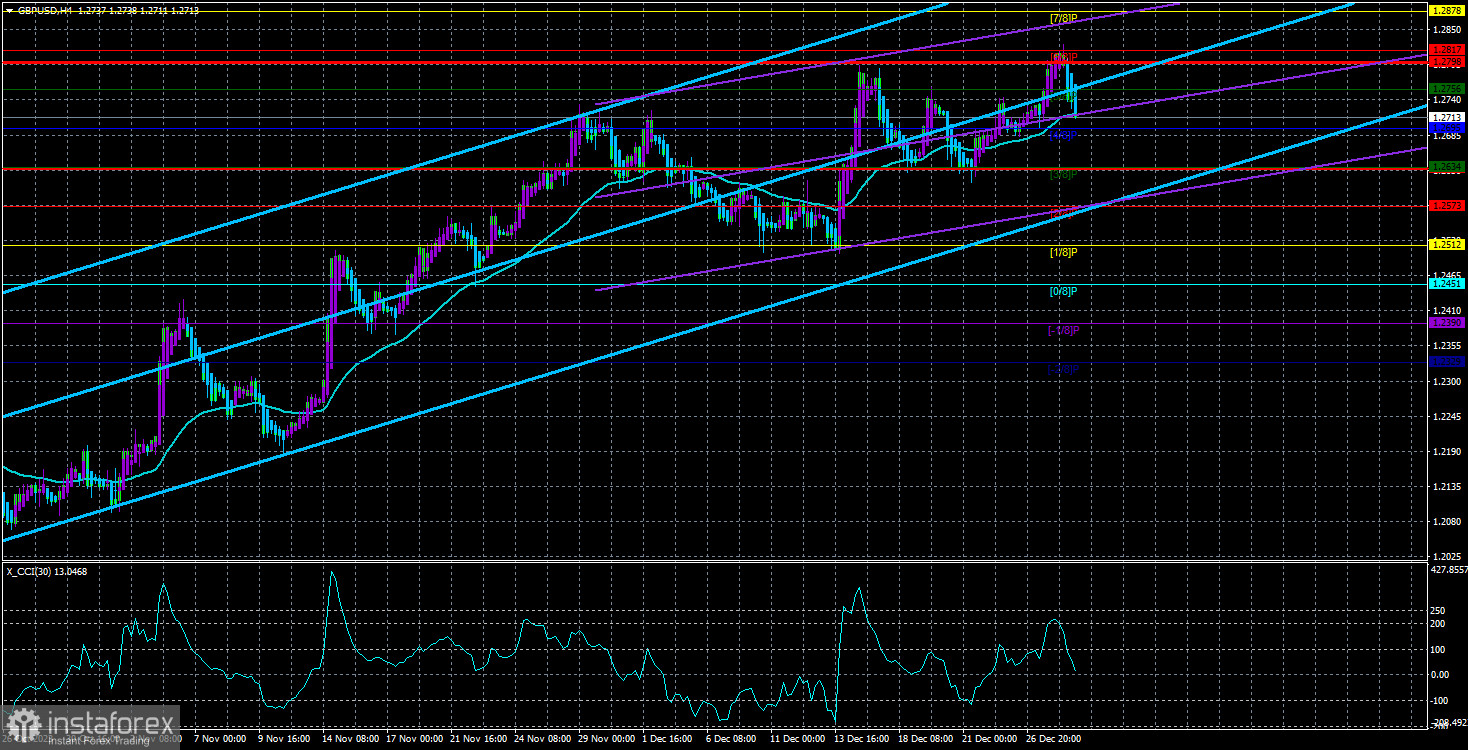
Once again, let's note the CCI indicator. Not only has it entered the overbought zone four times, but a "bearish" divergence was also formed yesterday, clearly visible in the illustration above. A bounce occurred from the Murray level "6/8" (1.2817), so now we receive new signals of a possible decline in the British currency.
Of course, everything will depend on the market itself again. If the market again refuses to buy the dollar and sell the pound, we won't see any decline, not even a small one. However, we still believe that trading illogically against the market cannot last forever, so a decline is impending. It has been impending for a month and a half but has not yet begun. It is sometimes hindered by macroeconomic statistics from across the ocean, sometimes by the results of the Fed and Bank of England meetings. If not for these events, the pound would most likely have plummeted.
If you look at the charts of the British currency, you can see that everything is fine in the UK. The economy is fine, financial conditions are wonderful, and inflation is within normal limits. But when you compare official statistics with the American ones, a reasonable question arises: why has the pound been appreciating for three months already? However, this question is rhetorical.
Many analysts have recently begun to note the absence of a recession in the UK and a high probability of a "soft landing" for the British economy. However, it's not just the state of the British economy that matters, but also the state of the American one. GBP/USD is a currency pair, so economic data from the UK and the US are important. Britain may have no recession, but there may be none in the EU and the US, whose economies grew by 5% in the last quarter.
Practically all the fundamental factors we regularly consider indicate a decline in the British currency. This does not mean that the decline should last forever and that the pound will return to almost parity. But it can reach $1.18 in 2024. Beyond that, it will depend on the pace of easing monetary policy in Britain and the US, new armed conflicts, new catastrophes, and other "charms" that have been accompanying humanity for several years now.
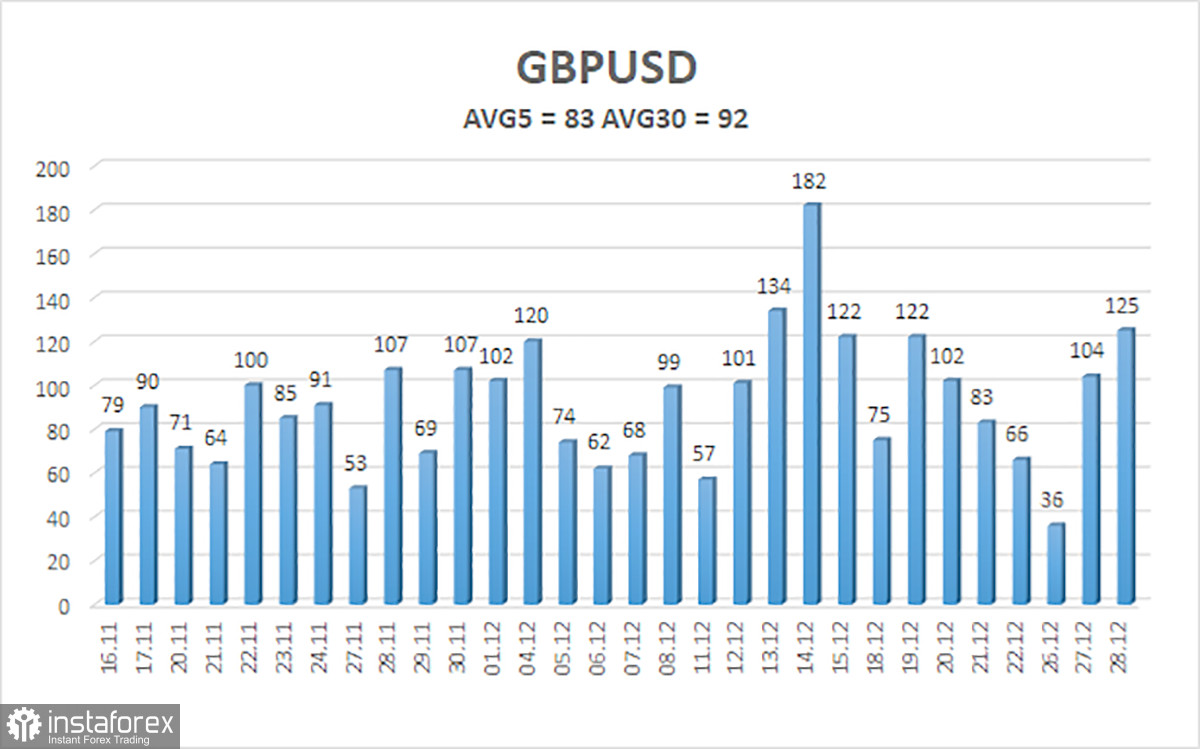
The average volatility of the GBP/USD pair over the last five trading days as of December 29th is 83 points. For the GBP/USD pair, this value is considered "average." Therefore, on Friday, December 29th, we expect movement within the range bounded by 1.2632 and 1.2798. A reversal of the Heiken Ashi indicator upwards will indicate a new upward movement phase.
The nearest support levels:
S1 – 1.2695
S2 – 1.2634
S3 – 1.2573
The nearest resistance levels:
R1 – 1.2756
R2 – 1.2817
Trading recommendations:
The GBP/USD currency pair continues to trade above the moving average line, but its growth still raises many questions. Traders can consider long positions since the technical picture remains entirely in favor of the bulls. However, during the current week, we have observed quite chaotic movements with little logic. Long positions can be considered again, with targets at 1.2817 and 1.2883 on a price bounce from the moving average. Short positions will become reasonable if the price closes below the moving average, with targets at 1.2634 and 1.2573.
Explanations for the illustrations:
Linear regression channels - help determine the current trend. If both channels point in the same direction, the trend is strong.
The moving average line (settings 20.0, smoothed) - determines the short-term trend and direction for current trading.
Murray levels - target levels for movements and corrections.
Volatility levels (red lines) - the likely price range the pair will move in the next day based on current volatility indicators.
CCI indicator - its entry into the oversold zone (below -250) or overbought zone (above +250) indicates an approaching trend reversal in the opposite direction.