4-hour timeframe
Technical data:
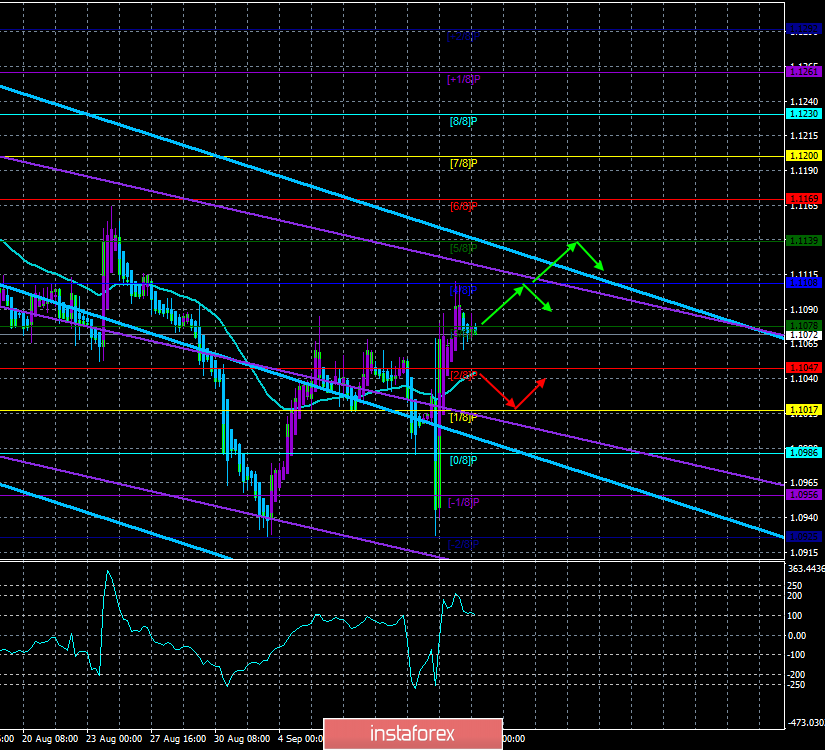
The upper channel of linear regression: direction – down.
The lower channel of linear regression: direction – down.
The moving average (20; smoothed) – up.
CCI: 96.4135
Last week, the EUR/USD pair was completely under the auspices of the"ECB meeting". First, traders waited for this meeting, as well as its results, and then practiced these same results. Something similar may be happening this week, as the Fed will hold a meeting on Wednesday at which Jerome Powell may announce a key rate cut of 0.25% to 2.0%. If this happens, it will be a sufficient reason for the sale of the US currency, from which market participants have long been unaccustomed. And until Wednesday, we have two" empty" in terms of macroeconomic events of the day. That is, Monday (today), traders can use to correct against the latest growth of the euro/dollar pair, and on Tuesday, play ahead and sell the dollar on expectations of a Fed rate cut. However, the probability of a rate cut is high, and it can be said that it is not more expected by market participants. Jerome Powell's speech is of great interest, as the market needs to understand the question of whether the rate cuts will be single and irregular, or the Fed has taken a course to lower the rate to zero in order not to lose ground in the currency wars with China and the European Union? The second option would mean that Donald Trump has convinced Powell and company (or crushed them with his criticism) of his innocence. We believe that if the easing of monetary policy is planned to zero, then the downward trend of the pair with a high degree of probability can be considered complete. If the rate reduction will occur from time to time (once or twice a year and only based on macroeconomic figures), the US dollar will remain in a better position than the euro. We have already said that the gap in the values of the key rates of the ECB and the Fed remains quite large and not in favor of the euro.
On Wednesday, the consumer price index will also be released in the eurozone, where everything is sad and, most likely, nothing will change. 1.0% of annual inflation is very little. Therefore, even taking into account the second easing of monetary policy by the US regulator, macroeconomic statistics from the European Union forces traders to get rid of it.
From a technical point of view, the euro has much more positive aspects than from a fundamental one. We still draw traders' attention to the "double bottom" pattern, which looks like in the tutorial. Given the duration of the downward trend for the euro/dollar pair, we can assume that it is completed. Now, however, it's all up to the bulls. If they find reasons to continue buying the pair, then all is well. But if the European Union will continue to disappoint with its statistics, and the United States will not systematically reduce the rate, the return of market participants to the sales of the euro – a matter of time.
Nearest support levels:
S1 – 1.1047
S2 – 1.1017
S3 – 1.0986
Nearest resistance levels:
R1 – 1.1078
R2 – 1.1108
R3 – 1.1139
Trading recommendations:
The euro/dollar pair began to adjust against the upward trend, as indicated by the Heiken Ashi indicator. Therefore, it is recommended to wait for the completion of correction and to resume small purchases of the pair with the targets of 1.1108 and 1.1139. It is not recommended to sell the euro until the price is fixed below the moving average.
In addition to the technical picture, fundamental data and the time of their release should also be taken into account.
Explanation of illustrations:
The upper linear regression channel – the blue line of the unidirectional movement.
The lower linear regression channel – the purple line of the unidirectional movement.
CCI – the blue line in the indicator window.
The moving average (20; smoothed) – the blue line on the price chart.
Support and resistance – red horizontal lines.
Heiken Ashi – an indicator that colors bars in blue or purple.