The EUR/USD currency pair continued its relentless upward movement for most of Thursday. However, it's hardly surprising to anyone, as the European currency has risen for three consecutive months. Yes, there are occasional corrections and pullbacks, but the question of "why is the euro rising?" remains unanswered. And this week, we have yet to move any closer to getting an answer. Of course, it's a holiday week, and it wasn't expected to provide answers, considering the complete absence of fundamental and macroeconomic background. However, it could have shown that market participants are waiting for news and reports and are ready to make informed and logical decisions. However, the current week doesn't show anything like that. The euro appreciated on Tuesday, rose on Wednesday, and rose on Thursday.
Therefore, talking about any logical movement right now is pointless. The pair can show impressive growth today because it doesn't need any grounds. The pair can start correcting today because it has risen too strongly again. The pair can start a prolonged decline because the CCI indicator has already entered the overbought zone four times. Anything is possible. And "anything" doesn't satisfy traders who want to trade based on technical and fundamental analysis.
The technical picture indicates growth, while the fundamental one suggests a decline. Based on this understanding, we should expect a decline, but entering the market with sales is not advisable until there are signals for selling and a change in the trend to a downward one.
Yesterday, ECB representative Robert Holzmann stated that thinking about easing monetary policy right now is too premature. He also noted that there are no guarantees of a rate cut next year, although there can't be any other option. But for some reason, Robert Holzmann has taken a very "hawkish" position, and the market hasn't reacted to new purchases of the euro. However, this once again proves the obvious fact: the euro is rising not because the ECB is not planning to ease monetary policy soon but because the Fed is planning to do so. Otherwise, Holzmann's speech would have provoked a new rise in the euro.
Interestingly, the market is already anticipating the first rate cut in the Eurozone in March–May 2024. That is, roughly the same time frame as the Fed. Thus, there can be no advantage for the European currency in connection with the upcoming changes in monetary policy. If both central banks start cutting rates and do so approximately simultaneously, what will cause the euro to rise?
For us, this question is rhetorical. The euro continues to rise "in the style of Bitcoin." That is, it rises because it is being bought. All technical indicators continue to point upwards, so every reversal of the Heiken Ashi indicator upwards is a reason to increase long positions. We still await a strong downward movement from the pair.
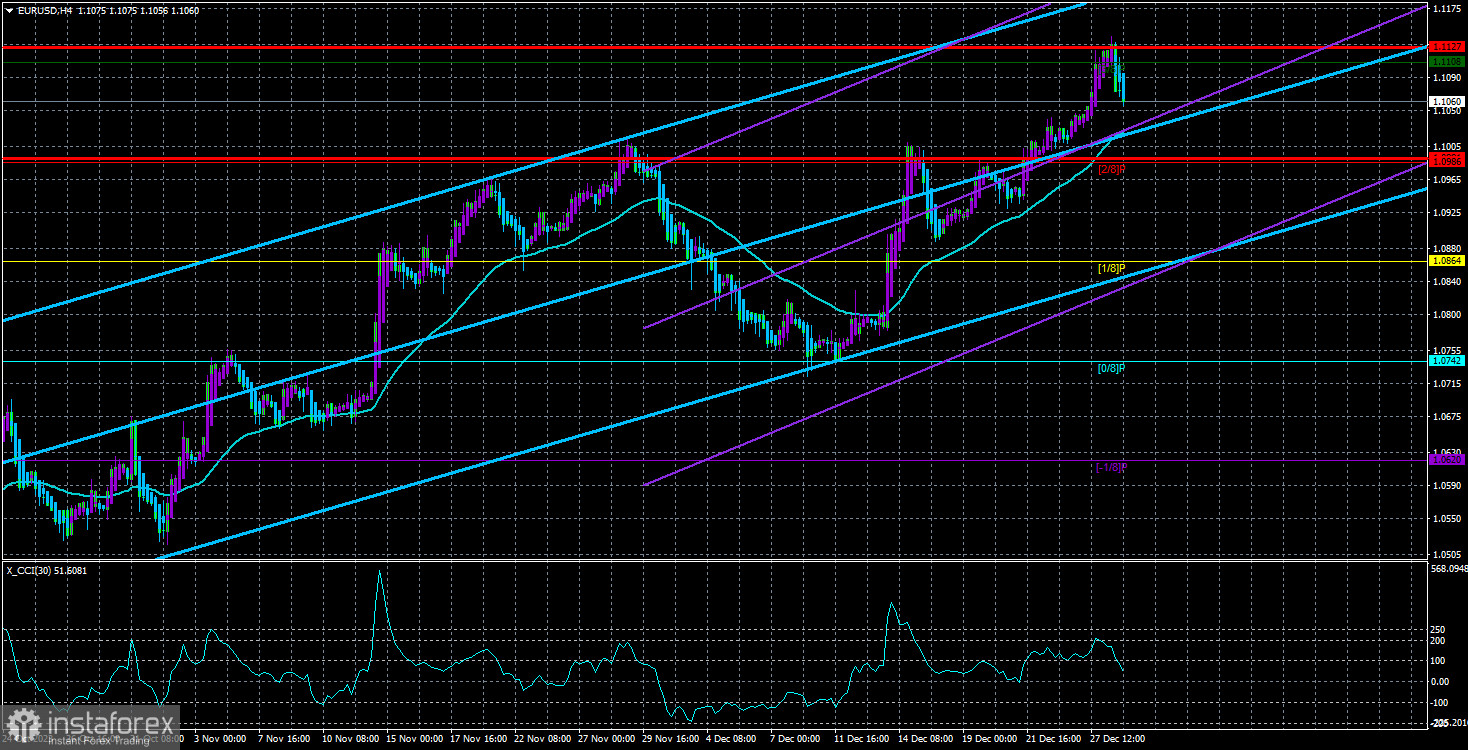
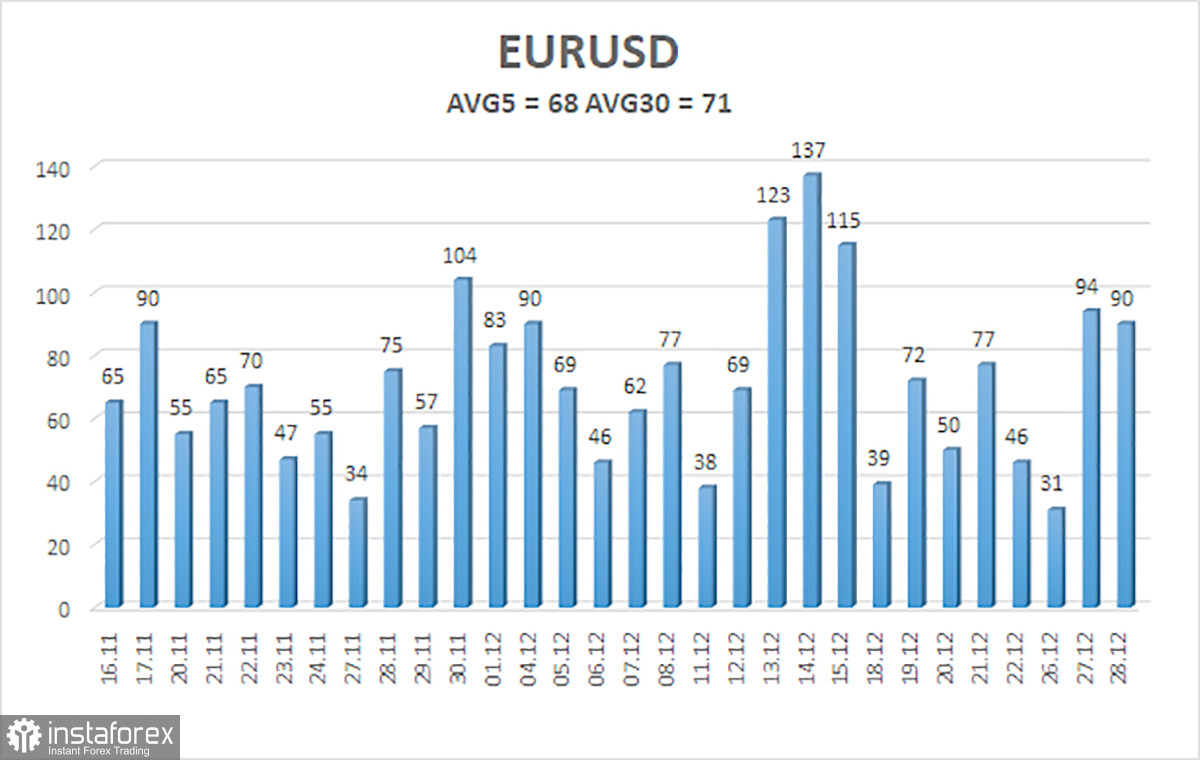
The average volatility of the EUR/USD currency pair over the last five trading days as of December 29th is 68 points and is characterized as "average." Therefore, we expect the pair to move between the levels of 1.0991 and 1.1127 on Friday. A reversal of the Heiken Ashi indicator upwards will indicate a resumption of the upward movement.
The nearest support levels:
S1 – 1.0986
S2 – 1.0864
S3 – 1.0742
The nearest resistance levels:
R1 – 1.1108
R2 – 1.1230
R3 – 1.1353
Trading recommendations:
The EUR/USD pair remains above the moving average line, but we still see no reason for further growth. The price has surpassed the psychological level of $1.10, so the uptrend is intact. The overbought CCI indicator still indicates the euro's excessively high price, but there are no signals of a trend reversal, so long positions with targets at 1.1173 and 1.1230 remain relevant. Short positions can be considered if the price closes below the moving average, with a target of at least 1.0864.
Explanations for the illustrations:
Linear regression channels - help determine the current trend. If both channels point in the same direction, the trend is strong.
Moving average line (settings 20.0, smoothed) - determines the short-term trend and direction for current trading.
Murray levels - target levels for movements and corrections.
Volatility levels (red lines) - the likely price range the pair will move in the next day based on current volatility indicators.
CCI indicator - its entry into the oversold zone (below -250) or overbought zone (above +250) indicates an approaching trend reversal in the opposite direction.