EUR/USD 5M
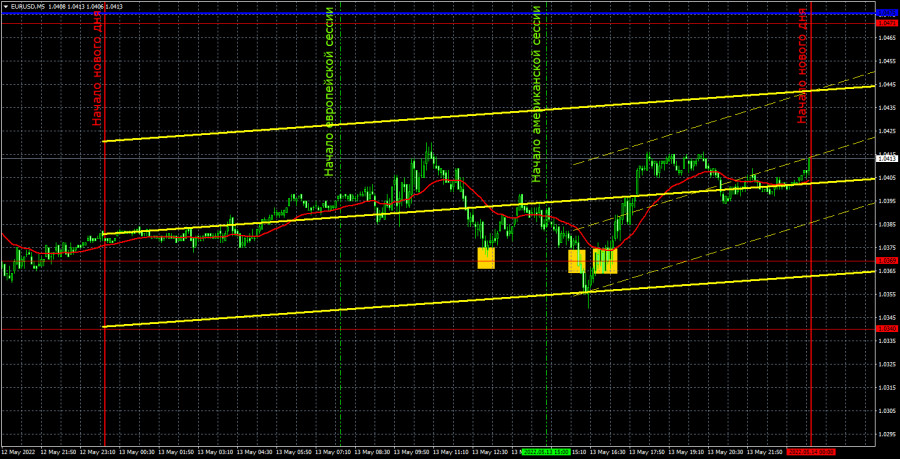
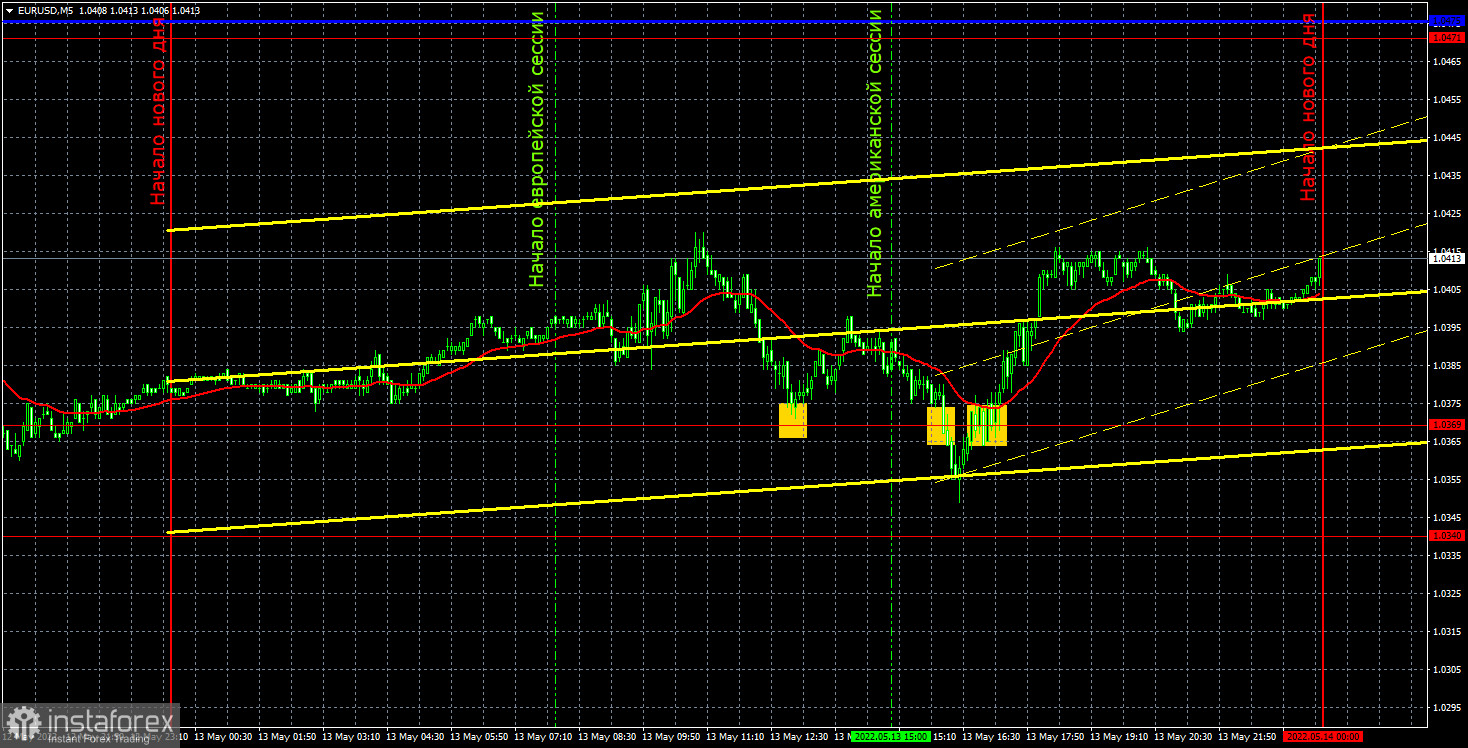
Last Friday, the EUR/USD pair tried to continue falling and even updated its 5-year lows, as well as Thursday's lows. However, this time, upon reaching the 1.0340-1.0369 area, which is exactly what forms the 20-year lows, the price nevertheless rebounded and began a new attempt to correct. As you might guess, the pair has not gone far from these lows, so the downward trend continues. Volatility remains quite high, and Friday's movements were quite strong. Let's deal with macroeconomic statistics right away. On Friday, there were two reports that could theoretically provoke a market reaction. Oddly enough, the report on industrial production in the EU and the mood of consumers in the US provoked each movement of points by 30. In the first case, the euro currency fell, since industrial production was lower than forecasts in March, and in the second case, the dollar was already falling, as the mood of consumers in the US in April dropped quite noticeably. However, these movements have practically no effect on the overall picture of the state of affairs.
In regards to trading signals on Friday, everything was very difficult and unpleasant. The first signal for long positions was formed near the level of 1.0369 with an error of 2 points. It should have been worked out, and the pair after its formation went up 18 points, therefore, traders had to set Stop Loss to breakeven. According to this Stop Loss, the deal was closed. The second signal for short positions was formed when the pair settled below the level of 1.0369, and this signal turned out to be frankly false. The price managed to go down only 15 points, which again was enough to set Stop Loss to breakeven. And this deal was also closed by Stop Loss. The third signal near the level of 1.0369 should no longer be worked out, since the first two turned out to be false. So, thanks to the high volatility, not a single point of loss was received on two false signals.
COT report:
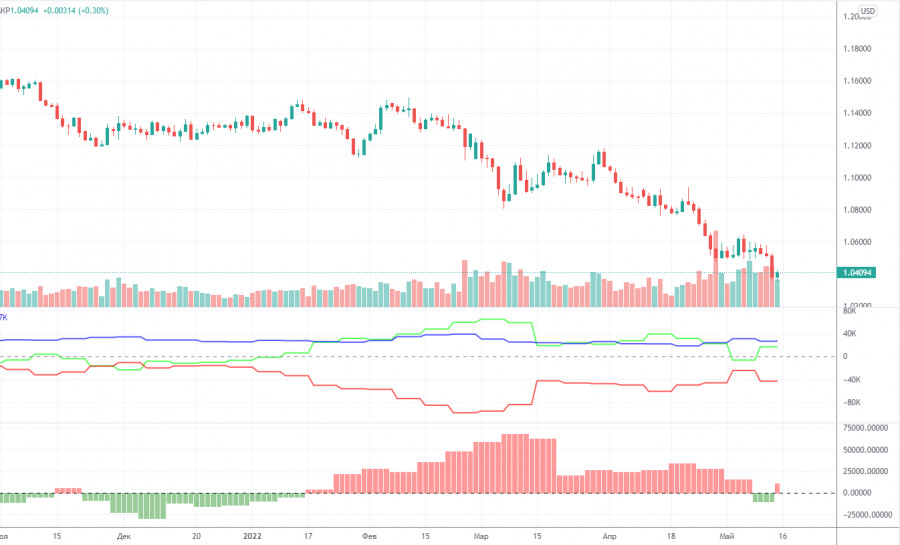
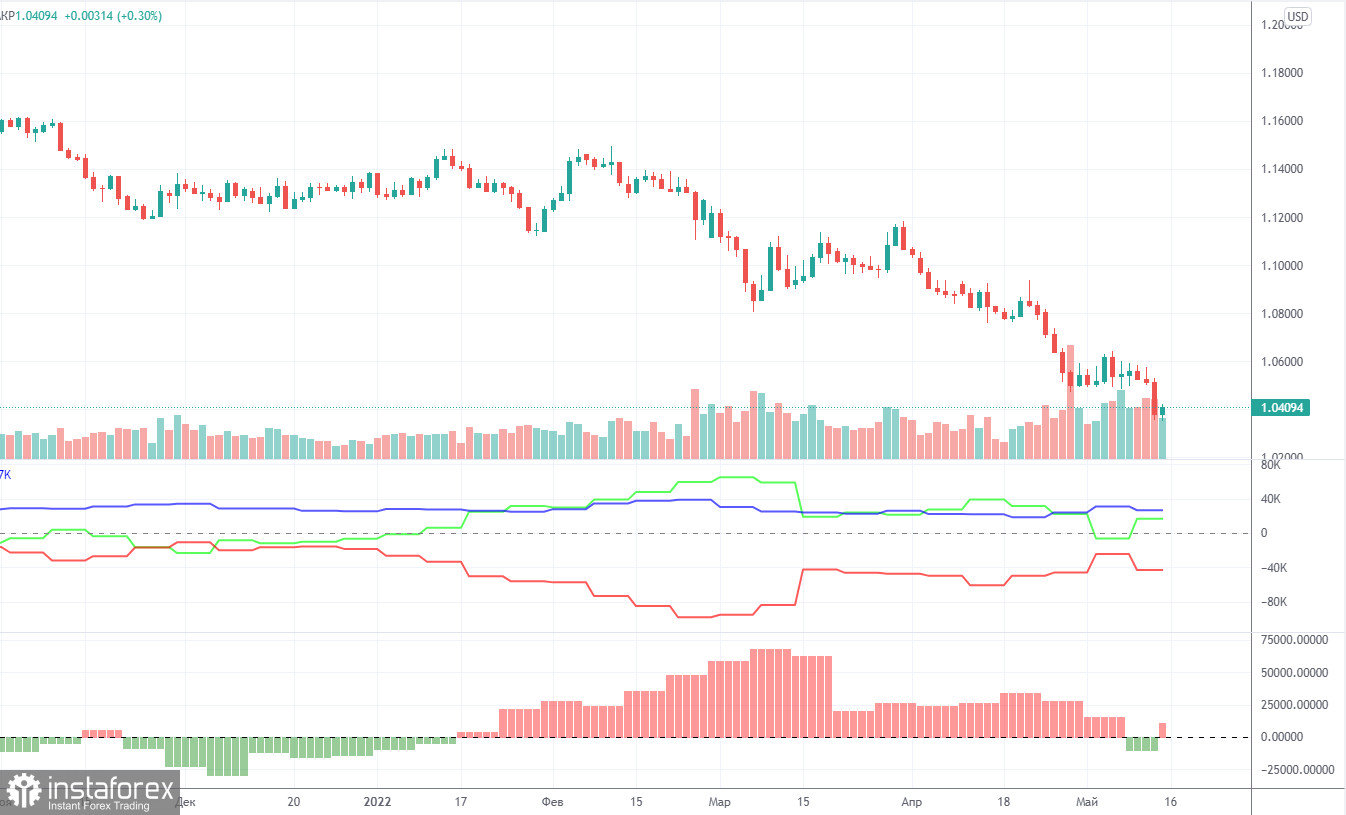
The latest Commitment of Traders (COT) reports on the euro raised more questions than they answered! The week before last, for the first time in a long time, the COT report showed a bearish mood among traders, which is logical, given the strong fall of the euro in recent months. However, the new COT report again showed an increase in bullish sentiment! During the reporting week, the number of long positions increased by 19,800, while the number of short positions in the non-commercial group decreased by 3,100. Thus, the net position grew by 23,000 positions per week. This means that the bearish mood has turned to bullish, as the number of longs now exceeds the number of shorts for non-commercial traders by 17,000. As a result, we again have a paradoxical picture in which big players buy more euros than they sell, but at the same time, the euro falls. From our point of view, this is because the demand for the US dollar is much higher than the demand for the euro. Even if someone suggested that the whole point is the weakening of the bullish mood in recent months (the second indicator is a histogram), then we recall that in the week between May 4 and 10, commercial traders opened 20,000 longs, and the euro increased by 30 points over the same period... Thus, it is still impossible to make a correlation between COT reports and what is happening in the market. Forecasts to build on such data, moreover, do not make sense.
We recommend that you familiarize yourself with:
Overview of the EUR/USD pair. May 16. Euro is preparing for another difficult week for itself.
Overview of the GBP/USD pair. May 16. The pound is trying to rise from the ashes and is waiting with horror for the inflation report.
Forecast and trading signals for GBP/USD on May 16. Detailed analysis of the movement of the pair and trading transactions.
EUR/USD 1H
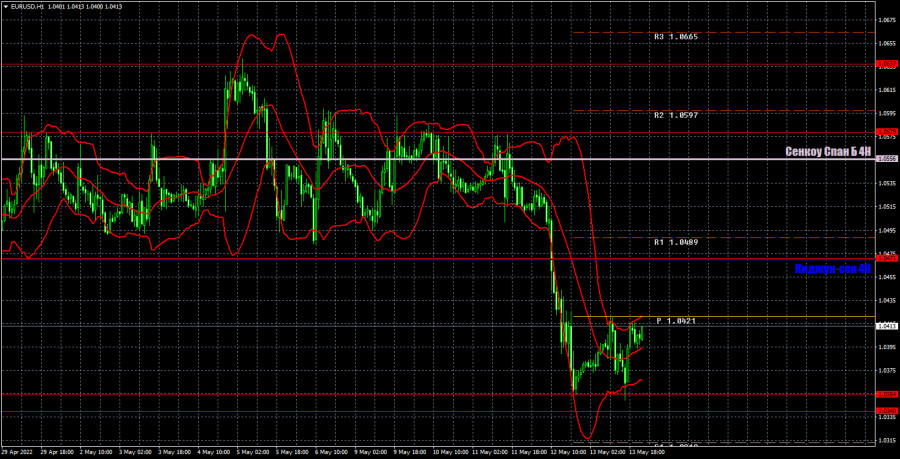
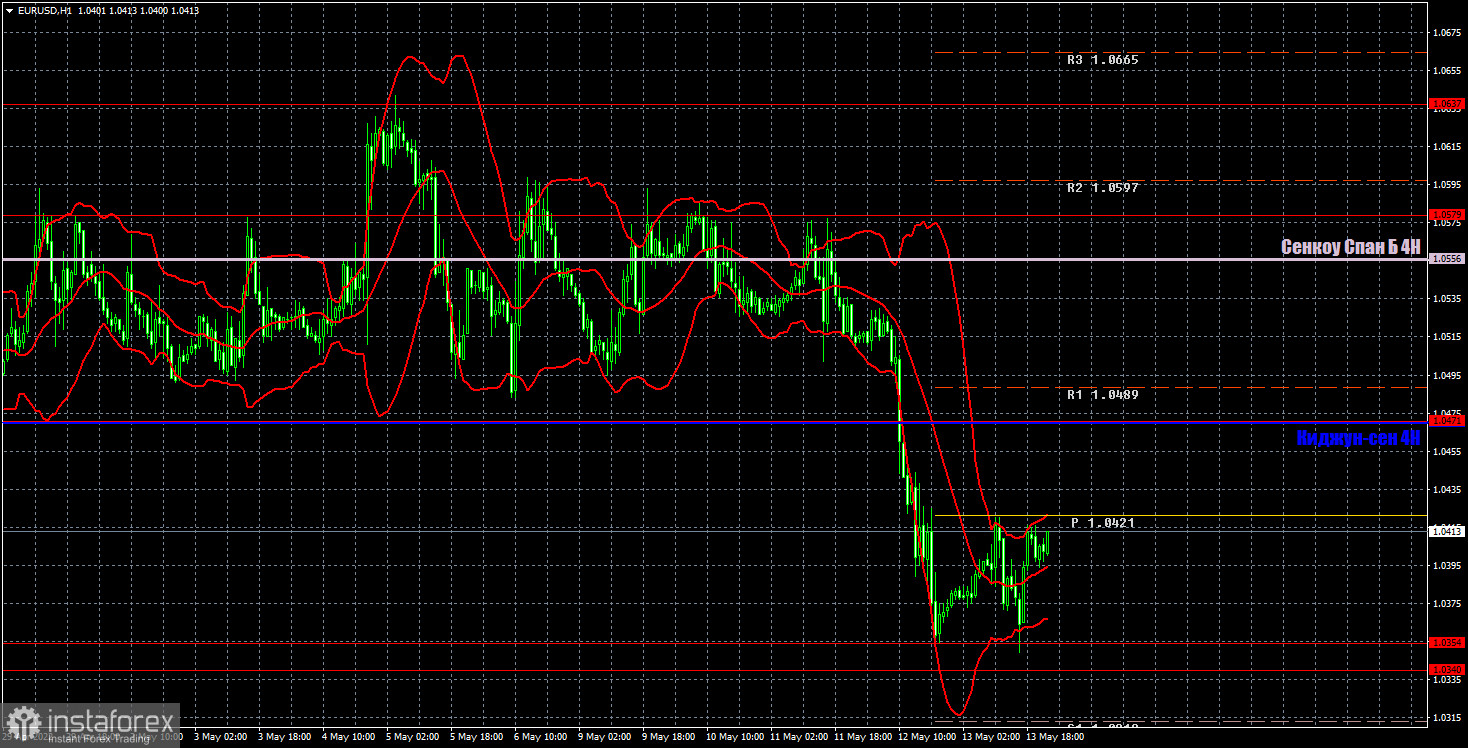
The pair continues its downward trend on the hourly timeframe and now we have a clear support area at 1.0340-1.0354, which represents the pair's 20-year lows. So far, the price has bounced twice from this area, but there are suspicions that it will be overcome. The euro is still unable to properly correct, so it is also unlikely to go up far. In any case, it is not necessary to expect a strong growth of the euro below the critical line. On Monday, we allocate the following levels for trading - 1.0340-1.0354, 1.0471, 1.0579, as well as the Senkou Span B (1.0556) and Kijun-sen (1.0470) lines. Ichimoku indicator lines can move during the day, which should be taken into account when determining trading signals. There are also secondary support and resistance levels, but no signals are formed near them. Signals can be "rebounds" and "breakthrough" extreme levels and lines. Do not forget about placing a Stop Loss order at breakeven if the price has gone in the right direction for 15 points. This will protect you against possible losses if the signal turns out to be false. Not a single important event is planned for May 16 in the European Union and the United States, so traders will have nothing to react to during the day. However, volatility may continue to be high.
Explanations for the chart:
Support and Resistance Levels are the levels that serve as targets when buying or selling the pair. You can place Take Profit near these levels.
Kijun-sen and Senkou Span B lines are lines of the Ichimoku indicator transferred to the hourly timeframe from the 4-hour one.
Support and resistance areas are areas from which the price has repeatedly rebounded off.
Yellow lines are trend lines, trend channels and any other technical patterns.
Indicator 1 on the COT charts is the size of the net position of each category of traders.
Indicator 2 on the COT charts is the size of the net position for the non-commercial group.