This section features the most important information about trading with InstaForex. We provide both analysis from leading experts for experienced traders and articles on trading conditions for beginners. Our services will help increase your profit potential.
Voir aussi
This section is designed for those who are just starting their trading journey. InstaForex educational and analytical materials will meet your training needs. Our experts' recommendations will make your first steps to trading success simple and clear.
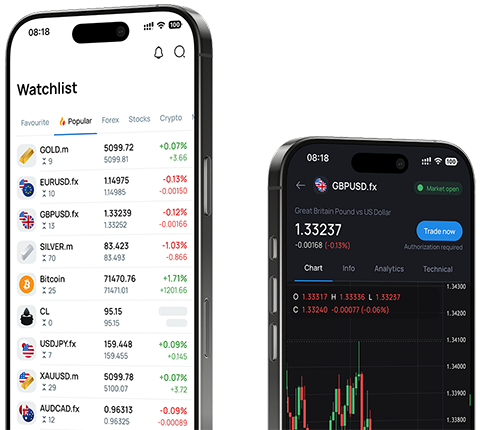
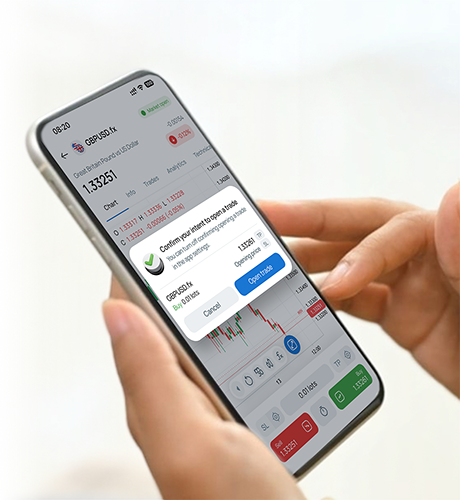
InstaForex innovative services are an essential element of productive investment. We strive to provide our clients with advanced technical capabilities and make their trading routine comfortable as we are recognized as the best broker in this regard.
Partnership with InstaForex is beneficial and top-tier. Join our affiliate programs and enjoy bonuses, partner rewards, and the possibility to travel with the team of the world-renowned brand.
This section contains the most lucrative offers from InstaForex. Receive bonuses when topping up an account, compete with other traders, and get real prizes even when trading in a demo account.
Holidays with InstaForex are not only pleasant but also useful. We offer a one-stop portal, numerous forums, and corporate blogs, where traders can exchange experiences and become successfully integrated into the Forex community.
InstaForex is an international brand created in 2007. The company provides services for online FX trading and is recognized as one of the world's leading brokers. We have won the trust of more than 7,000,000 retail traders, who have already appreciated our reliability and focus on innovations.