Hello, colleagues!
Although yesterday was not full of important macroeconomic reports, some data was released. First of all, these are IFO indices for Germany. All three IFO indices came out in the green zone. I believe that investors were particularly pleased with the improvement in business sentiment in the largest European economy.
The US yesterday received data only on the index of economic activity from the Federal Reserve of Chicago, which also turned out to be better than expected. Did yesterday's statistics influence the growth of the main currency pair? Possible. Nevertheless, I believe that technical factors had a greater impact on the course of Monday's trading.
Now about the coronavirus. If earlier the author assumed that the situation with the epidemic supports the US dollar, then yesterday's auction refuted this assumption. In Italy, especially in its Northern part, the coronavirus is rapidly spreading - the number of infected and dead is growing. People are panicking, everything is being swept off the shelves in stores and supermarkets, even drinking water. In particular, this situation is observed in Milan.
However, this did not prevent the single European currency from strengthening against the US dollar in yesterday's trading.
At the time of writing this article, data on the GDP of Germany was released. In the largest European economy, quarterly growth was the expected 0%, but the annual figure was worse: the forecast is 0.4%, the actual value is 0.3%.
However, the single European currency in most cases remains cold to its own statistics, which can not be said about macroeconomic reports from the United States, especially important and significant for the market.
Since the topic of American statistics is touched upon, the housing price index will be released today at 15:00 (London time), and the consumer confidence indicator will be published at 16:00 (London time). At the same time, I would like to note that the second report is more significant. Now let's go to the price charts.
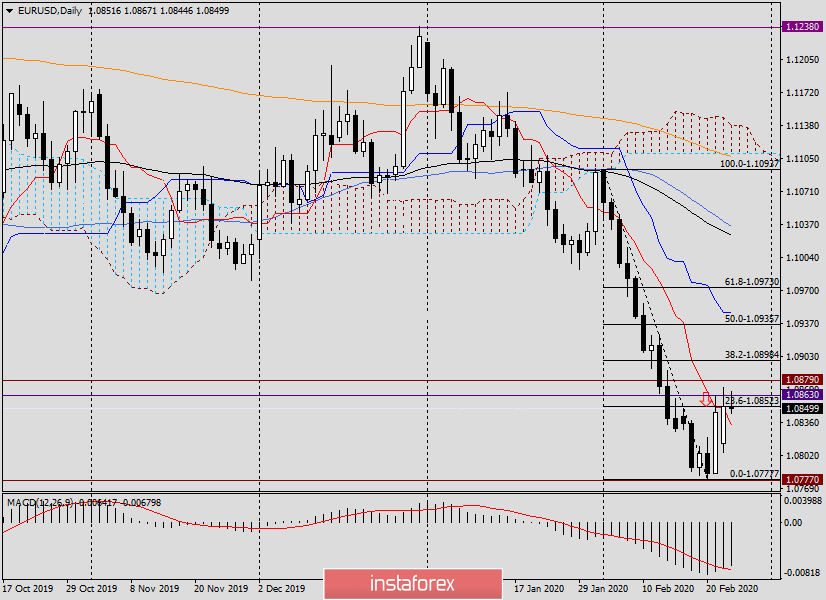
Daily
As expected yesterday, the closing of trading above the Tenkan line of the Ichimoku indicator will open the way to further prices. Although there is no need to hurry yet. In my opinion, only a return above the broken support level of 1.0879 will signal a false breakdown and send the pair to the strong price zone of 1.0900-1.0920. The Kijun line, which runs at 1.0947, will be a further benchmark for players to increase the rate. It makes no sense to talk about longer-term growth goals in the current situation. Euro bulls first need to return trades above 1.0879.
An alternative bearish scenario will have chances to be implemented if a black candle is formed with the closing price below yesterday's lows of 1.0805.
Judging by market sentiment and the technical picture on the daily chart, the ascending scenario looks more priority for the euro/dollar pair. Now let's move on to smaller time intervals.
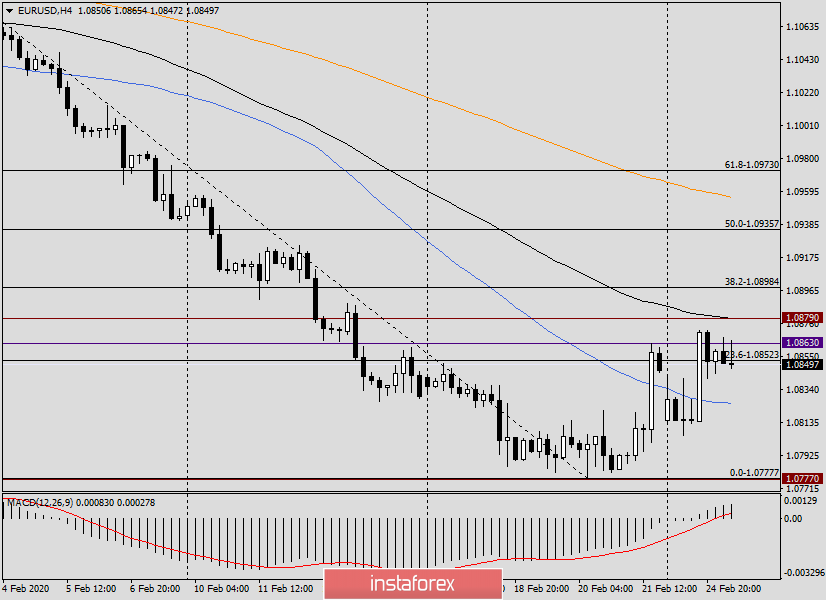
H4
The assumption about the importance of the breakdown of 1.0879 is also confirmed on this chart. A new exponential moving average has literally fallen on the broken support level, and there is no doubt that this moving average will provide additional resistance to growth attempts.
Judging by the technical picture at the 4-hour chart, I can offer two options for purchases. First, after the decline to the area of 1.0828, where the 50 MA passed up is located. The second option provides for a breakdown of 1.0879 and 89 EMA, a consolidation above and a pullback, after which we open long positions on EUR/USD.
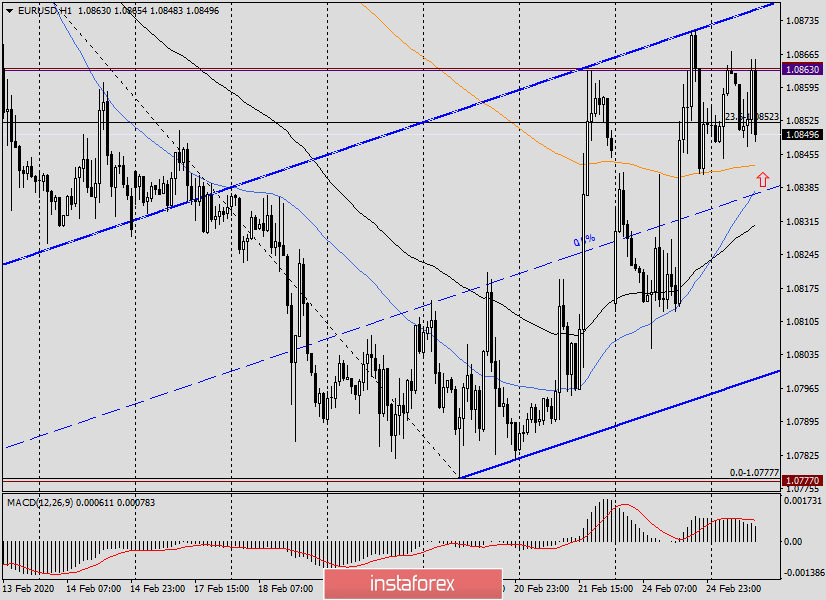
H1
On the hourly chart, I built a "young" ascending channel with the parameters: 1.0777-1.0782 (support line) and 1.0871 (resistance line).
Here, the options for opening positions are as follows. Purchases: when decreasing to the middle line of the channel - 50 MA and 89 EMA. This is the area of 1.0840-1.0830.
Further purchases should be considered if the pair falls to the lower border of the channel, where the horizontal level of 1.0805 also passes.
Sales: quite a curious situation. The fact is that the channel's resistance line runs in close proximity to the already mentioned level of 1.0879. If a candle or a combination of candles appears near the upper border of the channel indicating a decline, you can try opening short positions with the nearest targets in the area of 1.0825-1.0805.
Good luck!