empty
 
 
20.10.2021 11:52 AM
EUR/USD technical analysis on October 20, 2021

Hello, dear traders!

Unfortunately for bulls, yesterday's assumption that EUR/USD might lose most of its earlier gains came true. It all started on a positive note for the euro. As for the greenback, it came under pressure due to a decrease in Treasury yields. Speaking of the possibility of tapering by the Federal Reserve, the regulator is holding back on the decision. Investors await the Fed's November meeting during which the central bank is expected to announce the beginning of QE tapering. As for today's macroeconomic calendar, the main event that may somehow affect the euro/dollar pair will be the release of the consumer price index and the Fed's Beige Book. Let's now switch to EUR/USD charts.

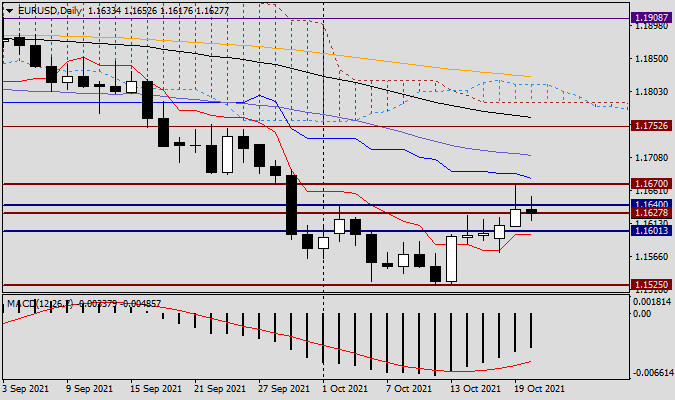
Daily chart

This image is no longer relevant

According to yesterday's review, the pair was expected to fall after a sharp rise in the morning, and a candlestick with a long upper shadow was likely to form. As we can see, the pair's attempts to return above the broken support level of 1.1664 failed. As soon as the quote approached 1.1670, euro bulls lost control over the course of trading. Indeed, euro bulls failed to break through bearish resistance at 1.1640. They just managed to close the session above the important technical level of 1.1600. However, it was not enough for the pair to extend its corrective move upward that started at 1.1525. Even if the price updates yesterday's highs at 1.1670, it does not mean that the uptrend will extend. Above there is a stoner technical and historical zone of 1.1700-1.1750. Only a true breakout at 1.1750 may indicate the continuation of the bullish trend. In such a case, however, the quote may encounter resistance at 1.1800. Generally speaking, euro bulls have a lot to work on. Above there are several strong and difficult-to-pass resistance levels. Taking into account the strength of support in the 1.1525-1.1500 region, the euro/dollar pair may well trade in the 1.1500-1.1700 area soon. To leave this range, the pair needs a strong driver that would determine the pair's prospects in the forex market.

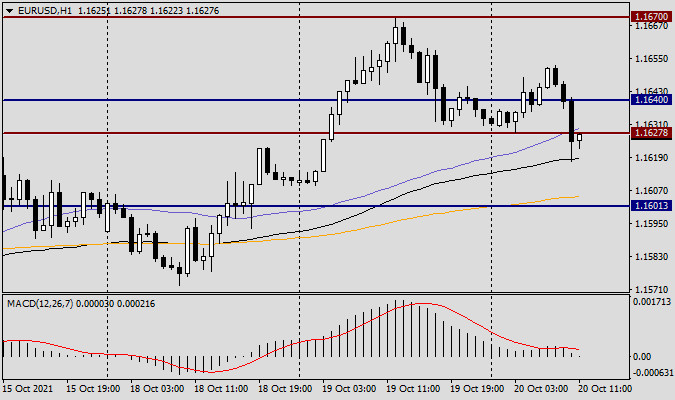
H1 chart

This image is no longer relevant

Although trading above the moving averages on the H1 chart, the quote is still facing pressure. In case bullish candlestick patterns occur on the H1 chart after the price approaches the MA (50) and/or the black EMA (89), it will be interpreted as a signal to open long positions with targets around the 1.1650-1.1670 region. A true breakout at 1.1627 followed by a bounce to this level is likely to generate a sell signal with targets in the area of 1.1600-1.1575. That's all for today.

Have a nice trading day!

Ivan Aleksandrov,
Analytical expert of InstaForex
© 2007-2024
Earn on cryptocurrency rate changes with InstaForex
Download MetaTrader 4 and open your first trade
  • Grand Choice
    Contest by
    InstaForex
    InstaForex always strives to help you
    fulfill your biggest dreams.
    JOIN CONTEST
  • Chancy Deposit
    Deposit your account with $3,000 and get $1000 more!
    In April we raffle $1000 within the Chancy Deposit campaign!
    Get a chance to win by depositing $3,000 to a trading account. Having fulfilled this condition, you become a campaign participant.
    JOIN CONTEST
  • Trade Wise, Win Device
    Top up your account with at least $500, sign up for the contest, and get a chance to win mobile devices.
    JOIN CONTEST
  • 100% Bonus
    Your unique opportunity to get a 100% bonus on your deposit
    GET BONUS
  • 55% Bonus
    Apply for a 55% bonus on your every deposit
    GET BONUS
  • 30% Bonus
    Receive a 30% bonus every time you top up your account
    GET BONUS

Recommended Stories

Can't speak right now?
Ask your question in the chat.
Widget callback