GBP/USD
Analysis:
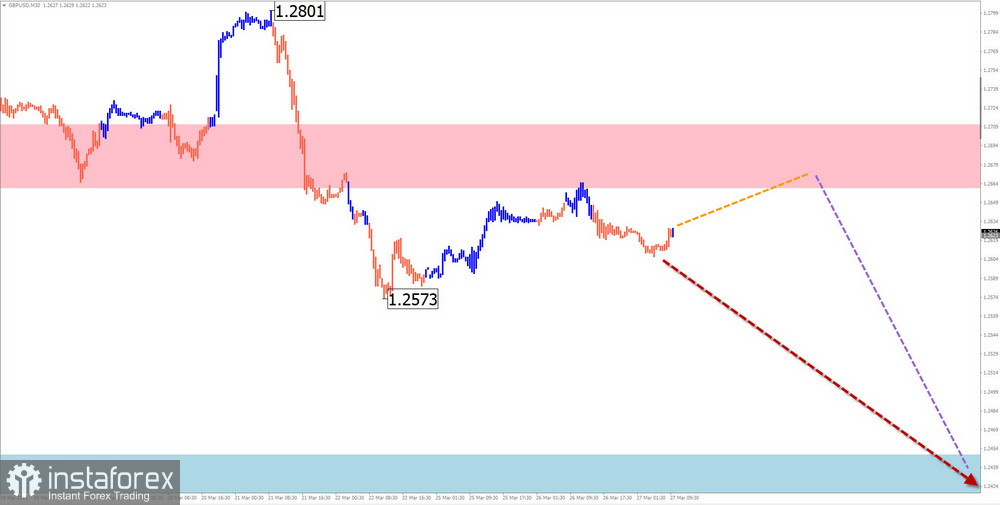
The analysis of the daily chart scale of the British currency demonstrates the incompleteness of the ascending wave model since October 4 of last year. Since December, the wave structure has been developing in the middle part (B). On March 8, its final part (C) started downwards. Throughout the past week, quotes formed a horizontal retracement, which was incomplete at the time of analysis.
Forecast:
A flat movement bias with an ascending vector is expected for the British pound in the coming days. Around the calculated resistance zone, a halt and conditions for a reversal can be anticipated. The resumption of the price decline is more likely to occur closer to the weekend.
Potential reversal zones:
Resistance:
Support:
Recommendations:
Buying: has no potential and may lead to losses.
Selling: after confirmation of reversal signals around the resistance zone, they may become the main direction for trading.
AUD/USD
Analysis:
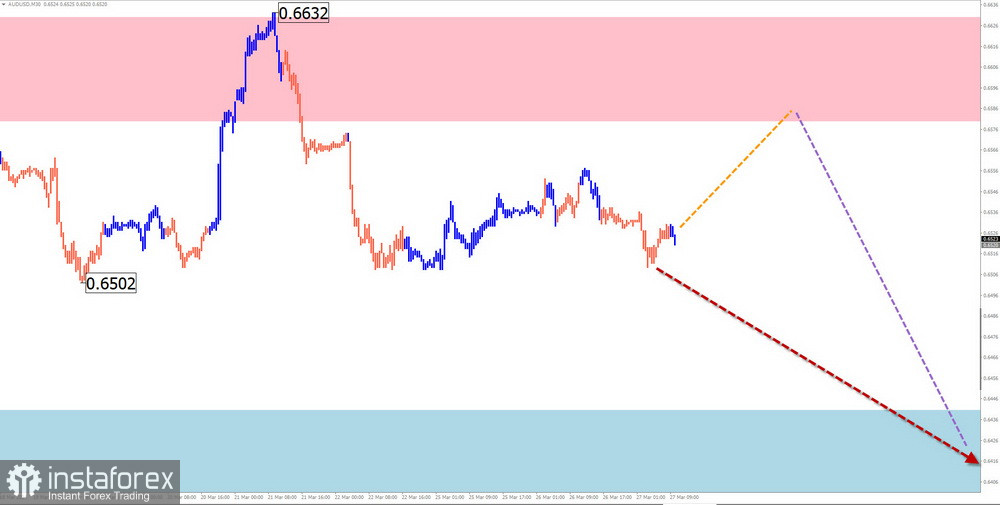
The descending wave of the Australian dollar major, which started in July last year, continues its formation. The final part (C) is developing in the wave structure. Within it, the price forms an upward intermediate retracement in the form of an elongated flat, which is still incomplete.
Forecast:
A general sideways movement can be expected in the next couple of days. The probability of a price increase is high. Closer to the weekend, an increase in volatility can be expected. A change in course and the resumption of price decline can be expected.
Potential reversal zones:
Resistance:
Support:
Recommendations:
Buying: possible with reduced volume size within individual sessions until the first reversal signals appear.
Selling: after corresponding signals appear around the calculated resistance zone, they may become the main direction for trading deals.
USD/CHF
Analysis:
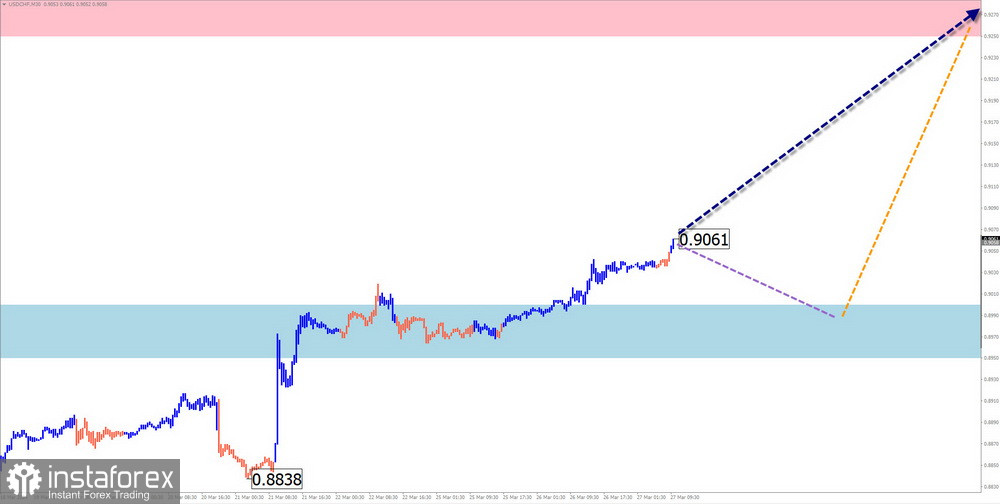
The analysis of the structure of the current ascending wave of the Swiss franc chart since December of last year shows the incompleteness of its final part (C). The price is at the upper boundary of a strong support zone. Before continuing the rise, the price needs confirmation in the form of a formed downward retracement.
Forecast:
A flat movement bias with a descending vector is expected in the coming days. A decrease is likely due to the boundaries of the calculated support. Closer to the weekend, the probability of increased volatility, change in course, and resumption of price rises increases. The upper boundary of the expected weekly movement is the calculated resistance.
Potential reversal zones:
Resistance:
Support:
Recommendations:
Selling: possible with reduced volume size within individual trading sessions.
Buying: may become profitable for trading after reversal signals appear around the support zone of your trading systems.
EUR/JPY
Analysis:
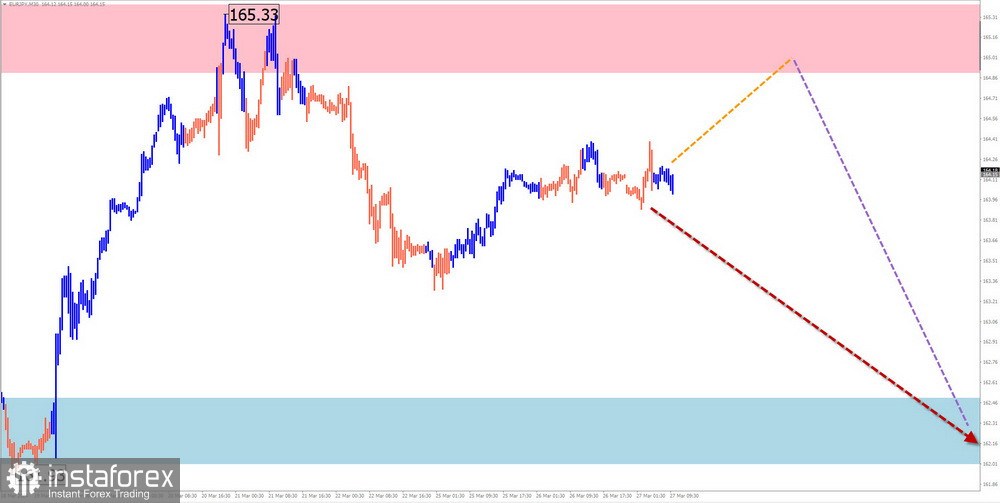
The unfinished bullish trend segment of the euro/Japanese yen pair has been counting since December of last year. A week ago, quotes in a sideways flat started forming a counter-correction. The structure of this wave segment needs to indicate completeness. The price is within a powerful potential reversal zone of the daily timeframe.
Forecast:
The pair's price will oscillate in the next week between zones of counter direction. An ascending vector is more likely at the beginning. Towards the end of the week, the probability of a change in direction and the pair's course downwards increases.
Potential reversal zones:
Resistance:
Support:
Recommendations:
Buying: may be used with fractional volumes within individual sessions.
Selling: becomes possible after confirmed reversal signals appear around the support zone.
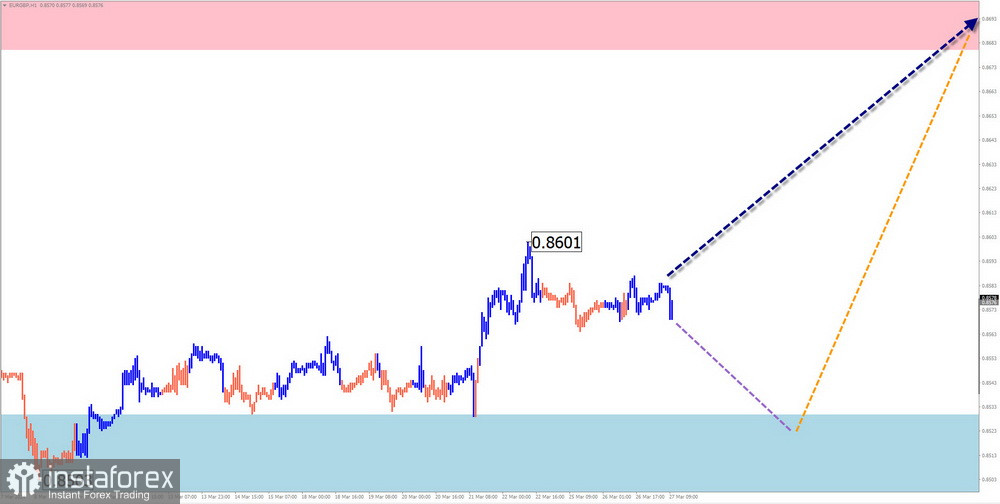
EUR/GBP
Analysis:
The dominant direction of the price trend of the euro/pound pair since February of last year sets the algorithm of a descending wave. The wave develops in the form of a horizontal flat. Since June, quotes have been drifting sideways, forming the middle part of the wave (B). The price is at the lower boundary of the corridor formed over the past months.
Forecast:
In the next few days, reversal signals around the support zone can be expected to form. A course change is more likely closer to the end of the week. A breakthrough of the lower boundary during a reversal is unlikely.
Potential reversal zones:
Resistance:
Support:
Recommendations:
Selling: has low potential and may result in loss of deposit.
Buying: may become prospective after confirmed reversal signals appear around the support zone.
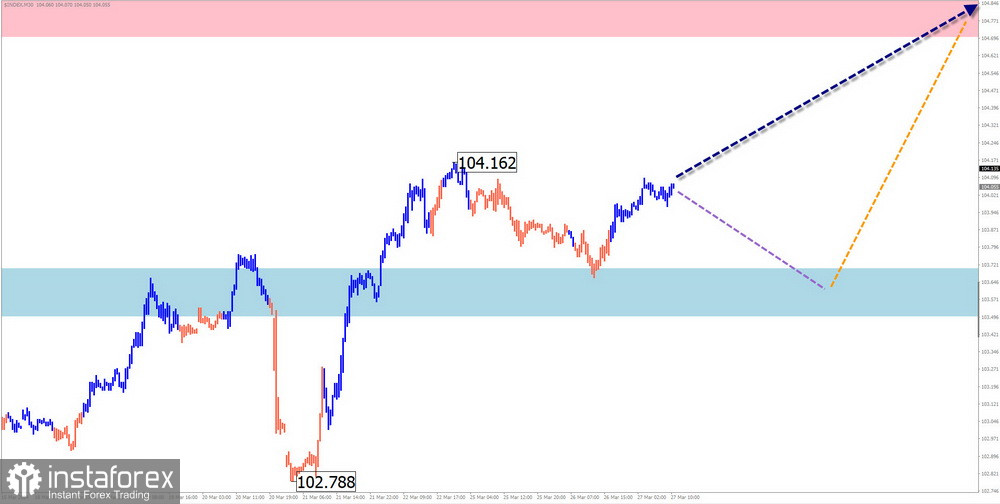
US dollar index
Analysis:
The quotes of the North American dollar index have been forming an ascending wave model since December of last year. The final part of the wave (C) started on March 11. From last week, quotes form a corrective retracement, after which the rise in the dollar exchange rate will continue.
Forecast:
In the next couple of days, a short-term decrease in the exchange rate can be expected up to the support zone. Closer to the weekend, a resumption of the upward movement of the index is expected. The resistance zone demonstrates the upper boundary of the expected weekly movement of the instrument.
Potential reversal zones:
Resistance:
Support:
Recommendations:
The decrease in the US dollar exchange rate will be short-term. Trading deals on weakening national currencies in major pairs may become profitable when reversal signals form around the calculated support.
Notes: In simplified wave analysis (SWA), all waves consist of 3 parts (A-B-C). The last unfinished wave is analyzed on each timeframe. Dotted lines indicate expected movements.