

 Bollinger bands indicator formula and settings
The Bollinger Bands indicator is a technical analysis instrument reflecting current fluctuations of an asset price (e.g. a share, commodity or currency).
The Bollinger Bands are calculated based on a standard deviation of a moving average. It is usually depicted on the price dynamics chart.
The Bollinger Bands are similar to the Envelopes. The difference between these two indicators is that borders of the Envelopes are situated above and below the moving average at a fixed distance, which is expressed in percent; while borders of the Bollinger Bands are built on the distance equal to the number of standard deviations. As the value of a standard deviation depends on volatility, the Bollinger Bands regulate their width on their own: it widens when the market is volatile; and it shrinks in stable periods.
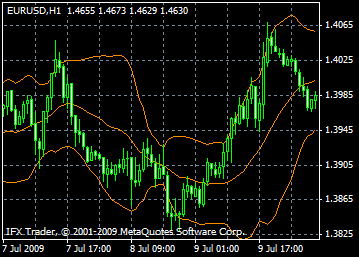
The Bollinger Bands are usually plotted on a price chart, but can be applied to an indicator chart as well. Like the Envelopes, the Bollinger Bands are based on the idea that prices tend to hold within the upper and lower limits of the bands. The unique feature of the Bollinger Bands as an indicator is their variable width that is due to price volatility. During periods of high volatility, the bands widen, giving prices a space. During periods of low volatility, the Bollinger Bands narrow holding prices within their boundaries.
The key features of this indicator are:
1. Abrupt changes in prices after band narrowing that reflects decreasing volatility.
2. If prices go beyond band boundaries, the current trend is expected to continue.
3. If highs and lows beyond the bands are followed by highs and lows within the bands, a trend reversal is possible.
4. A price movement started from one of the band boundaries usually reaches the opposite boundary.
The latest observation is useful for forecasting price targets.
Calculation
The Bollinger Bands are made up of three lines. The middle line (MIDDLE LINE, ML) is a simple moving average.
ML = SUM [CLOSE, N]/N
The upper line (TOP LINE, TL) is the middle line moved upwards by a certain number of standard deviations (D).
TL = ML + (D*StdDev)
The lower line (BOTTOM LINE, BL) is the middle line moved downwards by the same number of standard deviations.
BL = ML – (D*StdDev)
Where:
SUM (..., N) – sum for N periods
CLOSE – closing price
N – the number of periods used for calculation
SMA – simple moving average
SQRT – square root
StdDev – standard deviation:
StdDev = SQRT(SUM[(CLOSE – SMA(CLOSE, N))^2, N]/N)
It is recommended to use 20-period simple moving average as the middle line and two standard deviations to determine band boundaries. Besides, moving averages of less than 10 periods are not very efficient.

The InstaForex Analyst Team
GK InstaFintech © 2007-2025


Watch webinars
Forex webinar or interactive seminar is a modern and easily available way of learning how to trade Forex online. It is suitable for both novice and savvy investors
Watch webinars
Download InstaForex training course for beginners
Have you just started learning things about Forex? Don't miss our offer! Open a trading account and get the opportunity to download a ready-made training course created by InstaForex professional FX strategists
Download training course
Learn forex trading with tutor
The main training course includes 3 free lessons where our forex expert will tell you how to make accurate trading decisions and help you hone your practice skills
Learn more
InstaForex workshops
Register for workshops on topics which you are most interested in. They are available in online and offline formats. Our professional tutors will organize a thorough discussion of the chosen topics and will explain the most difficult things in a causal language
Learn more

