Yesterday, the single European currency arranged an exemplary performance on the subject of how to properly respond to published macroeconomic data. However, the data themselves came out completely not as expected and all without exception.

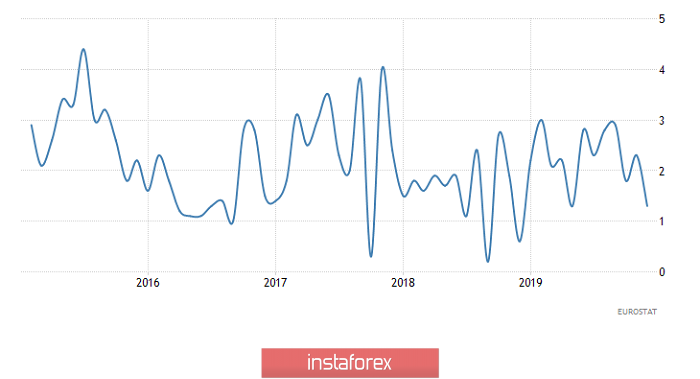
So, it all started with the final data on business activity indices in the euro area, which turned out to be multi-directional. On the one hand, the composite business activity index did not remain unchanged as expected, but increased from 50.9 to 51.3. And this is good of course, but it happened only due to the growth of the index of business activity in the manufacturing sector, which was published on Monday. However, the index of business activity in the service sector decreased, which generally coincided with forecasts. But they expected a decrease from 52.8 to 52.2, and not to 52.5, as it turned out in fact. Nevertheless, the market reacted rather calmly to this news, as they were waiting for data on retail sales. The growth rate of which should accelerate from 2.3% to 2.5%. However, they slowed down to as much as 1.3%, and the single European currency rushed down immediately.
Retail Sales (Europe):
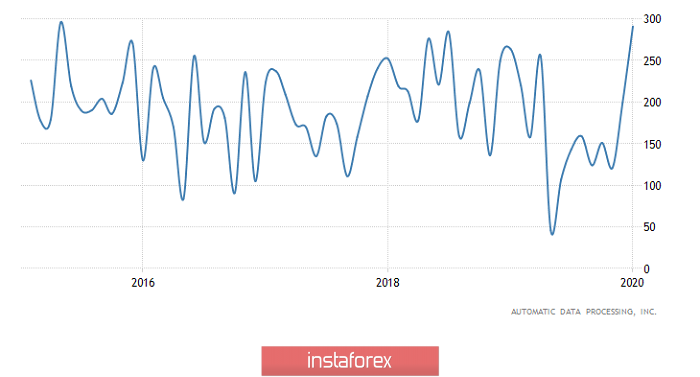
Nevertheless, a reversal movement is still expected, since forecasts on American statistics did not inspire optimism. But as soon as ADP employment data were published, these hopes were forgotten. It was forecasted that employment would increase by 142 thousand, after 199 thousand in the previous month, but in fact, it turned out that it increased by 291 thousand which is ahead of tomorrow's publication of the report of the United States Department of Labor. As soon as market participants saw these figures, the single European currency went down with renewed strength. It can be said that the data on business activity indices in the United States became a kind of striking blow that put an end to this drama. Thus, the index of business activity in the service sector increased from 52.8 to 53.4, while they expected growth to 53.2. The composite index of business activity, which was supposed to grow from 52.7 to 53.1, grew to 53.3. Thus, the growth of the dollar should not surprise anyone. Another thing is that it came as a surprise, due to the complete discrepancy between the actual data and the forecast.
Employment Change from ADP (United States):
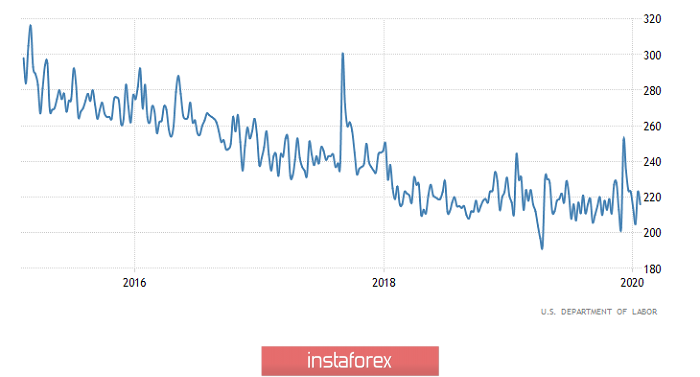
Today, only the data on applications for unemployment benefits are worthy of attention. The total number of which should be reduced by 5 thousand. The number of initial applications may increase by 3 thousand, while the number of repeated applications may be reduced by 8 thousand. In general, the forecasts are neutral, but employment data suggests that the number of applications can be reduced much more. However, it is unlikely that investors are willing to take risks in anticipation of the publication of the report of the United States Department of Labor, especially since they are likely to be different than expected. As a result, there will be some break in the market which may be accompanied by a creeping correction, which will last throughout the day. So it will only be possible to see it closer to the close of trading.
Number of Initial Jobless Claims (United States):
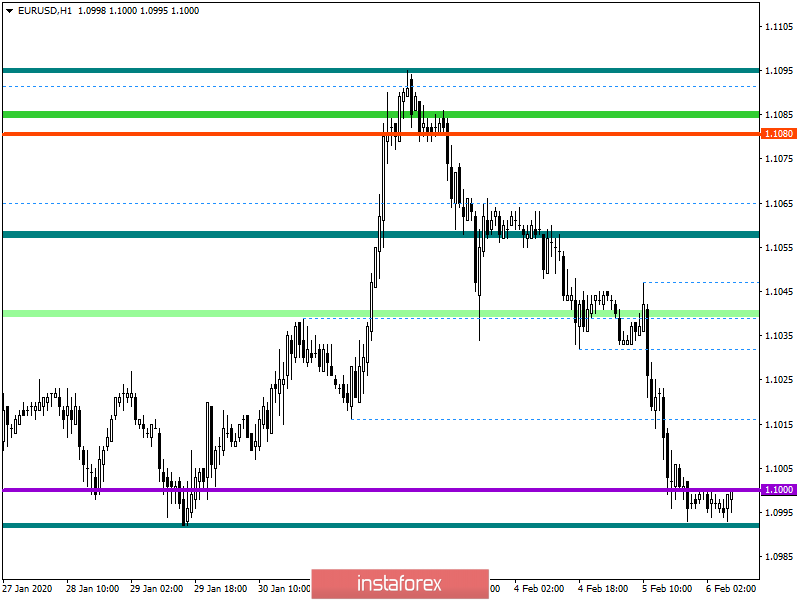
From the point of view of technical analysis, we see a rapid decline into the area of the psychological level of 1.1000, where stagnation re-formed. In fact, we see the attempt of a second breakdown from the beginning of the year, where the quote is trying to overcome the control value, but the pressure on the quote remains.
In terms of a general review of the trading chart, we see a continuing downward trend set in early January, where the average daily volatility is showing growth. Regarding global trends, we are in the region of 60% of working from an oblong correction, which is developing in a downward trend.
It is likely to assume that the quote will focus on the range 1.0990 / 1.1040 due to the pressure from the control level, regarding which actions will be taken. The tactics of the work are built according to the method of breakdown of specified boundaries, with the identification of points of price fixation.
Concretizing all of the above into trading signals:
- Long positions are considered in case of price fixing higher than 1.1045.
- Short positions are considered in case of price fixing lower than 1.10985.
From the point of view of a comprehensive indicator analysis, we see that indicators of technical tools signal a sale due to a holding downward mood. Thus, it is worth considering that in case of deceleration, we may encounter a variable signal with respect to shorter time sections.