empty
 
 
21.03.2022 07:43 AM
GBP/USD breaking forecast on March 21, 2022

There are two reasons why the pound is now flat and the scale of its Friday price change was purely symbolic.

Firstly, the current fundamental background related to the Ukraine conflict and sanctions against Russia remains the same. Neither Russia nor the West has made any important statements, especially in regards to the easing or tightening of the sanctions regime. From a certain point of view, this is nothing more than a sign of a stabilizing situation.

Secondly, today's macroeconomic calendar is completely empty. So, market participants have nothing to focus on.

Although no important macro events are to unfold, there will be some fundamentals worth paying attention to. The United States and the eurozone are now preparing one more package of sanctions against Russia. It is likely to target certain people and companies, so it will not be harmful enough to the Russian economy. However, a row of large media companies, mainly in the US, are now speculating on the possibility of a full embargo on Russian energy, in particular, oil. Such a decision could be fatal for Europe as well as for the entire world as all energy prices would skyrocket. The European Union refused to make such a step two weeks ago as it simply could not find necessary volumes of oil and gas elsewhere. For that reason, an embargo would be nothing more than suicide. Anyway, media reports on the issue will make market participants nervous, and turmoil in the market will definitely have an impact on the pound sterling.

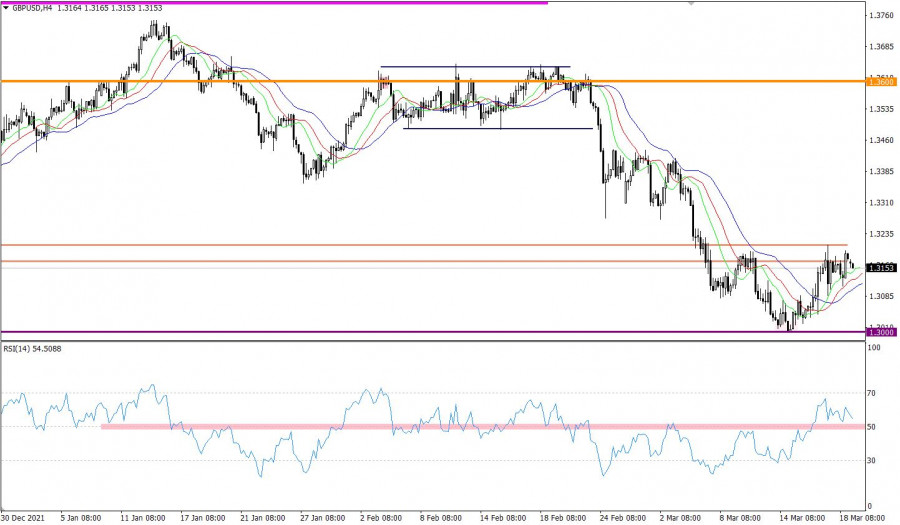
GBP/USD has been hovering around resistance in the range between 1.3180 and 1.3200 for three days. Eventually, the corrective move slowed and the price came to a standstill. In the medium term, the market has been bearish since June 2021 with support seen at the psychological level of 1.3000.

The Relative Strength Index is moving down towards the middle in the H4 time frame. If the indicator crosses line 50 top-bottom, it could make a sell signal.

The Alligator indicator shows a correction in the H4 time frame as its moving averages are moving up. In case of a pullback from resistance, a reversal will occur. On the daily chart, the Alligator indicates a downtrend in the medium term as there has been no crossover of the moving averages.

Outlook:

The flat movement is about to end, and speculation could increase in the range between 1.3100 and 1.3200. In this light, trading on a breakout of one or the other limit of the range seems more reasonable.

Speaking of complex indicator analysis, there is a variable signal for short-term and intraday trading because of the flat market. Indicators are signaling to sell the instrument in the medium term due to the current downtrend.

This image is no longer relevant

Dean Leo,
Analytical expert of InstaForex
© 2007-2024
Earn on cryptocurrency rate changes with InstaForex
Download MetaTrader 4 and open your first trade
  • Grand Choice
    Contest by
    InstaForex
    InstaForex always strives to help you
    fulfill your biggest dreams.
    JOIN CONTEST
  • Chancy Deposit
    Deposit your account with $3,000 and get $9000 more!
    In May we raffle $9000 within the Chancy Deposit campaign!
    Get a chance to win by depositing $3,000 to a trading account. Having fulfilled this condition, you become a campaign participant.
    JOIN CONTEST
  • Trade Wise, Win Device
    Top up your account with at least $500, sign up for the contest, and get a chance to win mobile devices.
    JOIN CONTEST
  • 100% Bonus
    Your unique opportunity to get a 100% bonus on your deposit
    GET BONUS
  • 55% Bonus
    Apply for a 55% bonus on your every deposit
    GET BONUS
  • 30% Bonus
    Receive a 30% bonus every time you top up your account
    GET BONUS

Recommended Stories

Can't speak right now?
Ask your question in the chat.
Widget callback