empty
 
 
07.02.2023 04:30 PM
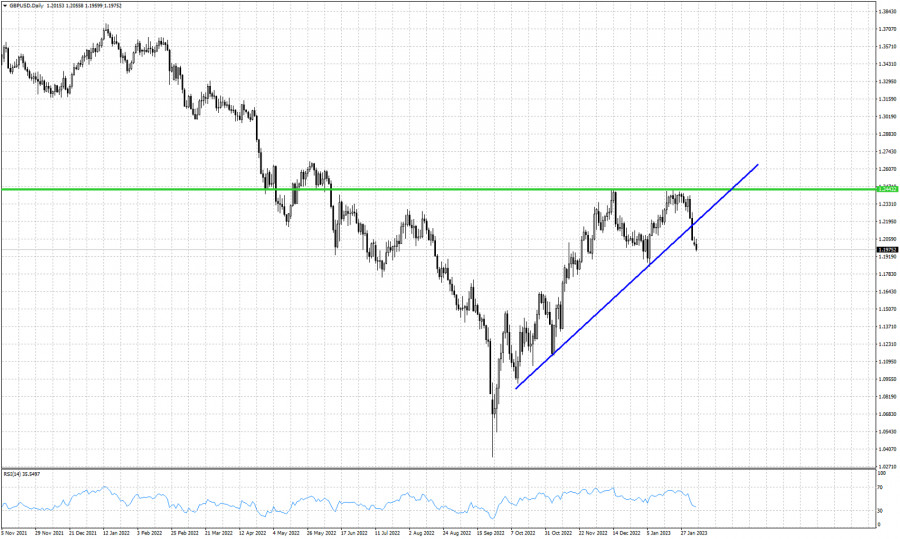
Technical analysis on GBPUSD for February 7th, 2023.

This image is no longer relevant

Green line- resistance

Blue line- support trend line (broken)

GBPUSD is in a short-term bearish trend. Price is trading at 1.1980 making new lower lows and lower highs, approaching our short-term target of 1.19-1.18 after it broke below the blue upward sloping trend line. Traders were warned that GBPUSD was vulnerable for a reversal after the double top rejection at the horizontal green resistance. GBPUSD has retraced more than 61.8% of the last leg upwards. Further move to the downside will bring even more sellers and push price towards 1.18. Support is at 1.1950. This is the last line of defense for the near term bulls. The RSI is oversold and at least a bounce towards 1.2050-1.21 is justified. Our preferred scenario is for GBPUSD to bounce before continuing lower.

GBPUSD
Great Britain Pound vs US Dollar
Select timeframe
5
min
15
min
30
min
1
hour
4
hours
1
day
1
week
Start trade
Start trade
  • Grand Choice
    Contest by
    InstaForex
    InstaForex always strives to help you
    fulfill your biggest dreams.
    JOIN CONTEST
  • Chancy Deposit
    Deposit your account with $3,000 and get $8000 more!
    In March we raffle $8000 within the Chancy Deposit campaign!
    Get a chance to win by depositing $3,000 to a trading account. Having fulfilled this condition, you become a campaign participant.
    JOIN CONTEST
  • Trade Wise, Win Device
    Top up your account with at least $500, sign up for the contest, and get a chance to win mobile devices.
    JOIN CONTEST
  • 100% Bonus
    Your unique opportunity to get a 100% bonus on your deposit
    GET BONUS
  • 55% Bonus
    Apply for a 55% bonus on your every deposit
    GET BONUS
  • 30% Bonus
    Receive a 30% bonus every time you top up your account
    GET BONUS

Recommended Stories

Forex forecast 03/24/2023 GBP/USD, USD/CHF, USD/CAD and Bitcoin from Sebastian Seliga

Let's take a look at the technical picture of GBP/USD, USD/CHF, USD/CAD and Bitcoin

Sebastian Seliga 09:59 2023-03-24 UTC+2

Video market update for March 24, 2023

Potential for the rally on USD/JPY

Petar Jacimovic 09:35 2023-03-24 UTC+2

USD/JPY analysis for March 24, 2023 - Potential for the rally

Technical analysis: USD/JPY has been trading downside in the background but I found falling wedge pattern in creation and potential upside movement. Due to potential downside exhaustion and bull crosses

Petar Jacimovic 09:35 2023-03-24 UTC+2

Analysis of Gold for March 24,.2023 - Potential for the further upside movement

Technical analysis: Gold has been trading upside and I see potential for the breakout of the bull flag pattern. Due to the strong upside trend in the background and bull

Petar Jacimovic 09:13 2023-03-24 UTC+2

BTC update for March 24,.2023 - Tight range and potential for the breakout

Technical analysis: BTC/USD has been trading sideways at the price of $28.460 and I see potential for the breakout mode. Due to the strong upside trend in the background

Petar Jacimovic 09:08 2023-03-24 UTC+2

Technical Analysis of GBP/USD for March 24, 2023

Technical Market Outlook: The GBP/USD pair has made a new swing high at the level of 1.2342 and pulled-back towards the level of 1.2260. The momentum is strong and positive

Sebastian Seliga 09:01 2023-03-24 UTC+2

Technical Analysis of EUR/USD for March 24, 2023

Technical Market Outlook: The EUR/USD pair has made a new swing high at the level of 1.0930 and the rally was capped at the level due to the extremely overbought

Sebastian Seliga 09:00 2023-03-24 UTC+2

Indicator analysis: Daily review of GBP/USD on March 24, 2023

The pound-dollar pair may move downward from the level of 1.2285 (closing of yesterday's daily candle) to 1.2209, the 23.6% pullback level (yellow dotted line). Upon reaching this level

Stefan Doll 08:55 2023-03-24 UTC+2

Indicator analysis: Daily review of EUR/USD on March 24, 2023

The euro-dollar pair may move downward from the level of 1.0832 (closing of yesterday's daily candle) to 1.0696, the 38.2% pullback level (yellow dotted line). When testing this level

Stefan Doll 08:45 2023-03-24 UTC+2

BTCUSD, H4 | Potential Reversal from a key level ?

The BTC/USD chart is currently bearish, indicating potential further price drops. The first resistance level at 28342 could prompt a bearish reaction towards the first support level at 26557. This

Dean Leo 06:10 2023-03-24 UTC+2
Can't speak right now?
Ask your question in the chat.