GBP/USD
Analysis:
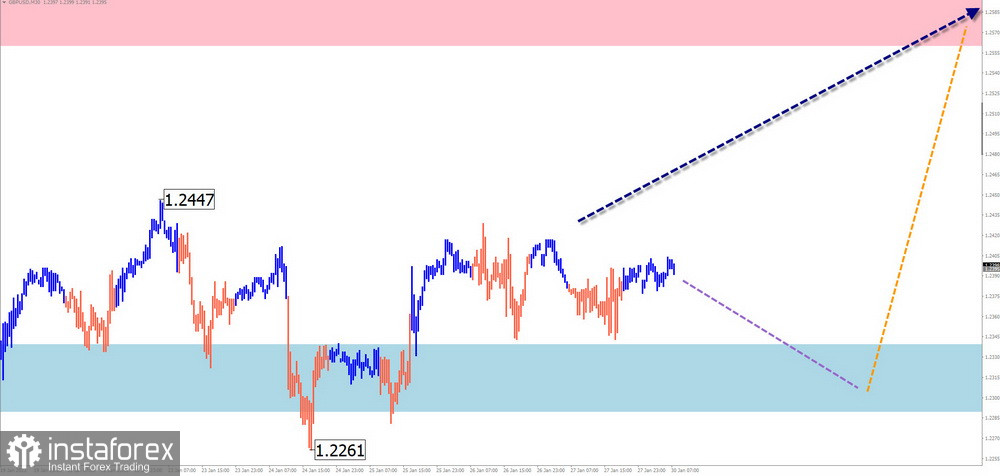
The British pound has been following the trend of the incomplete ascending wave that has been developing since late September last year. The pair has been forming a complex corrective movement in the form of a flat channel since November. Its structure has not been completed yet. The ascending section of January 6 has a reversal potential. The price is going through a correction alongside interim support.
Forecast:
In the coming days, the pound is expected to trade sideways along the support zone. The second half of the week may be more volatile, and the pair may resume its uptrend toward the resistance area.
Potential reversal zones
Resistance:
- 1.2560/1.2610
Support:
- 1.2340/1.2290
Recommendations:
Sell: no conditions for selling are seen in the coming days.
Buy: when confirmed signals appear near the resistance zone. It is safer to trade with fractional lots.
AUD/USD
Analysis:
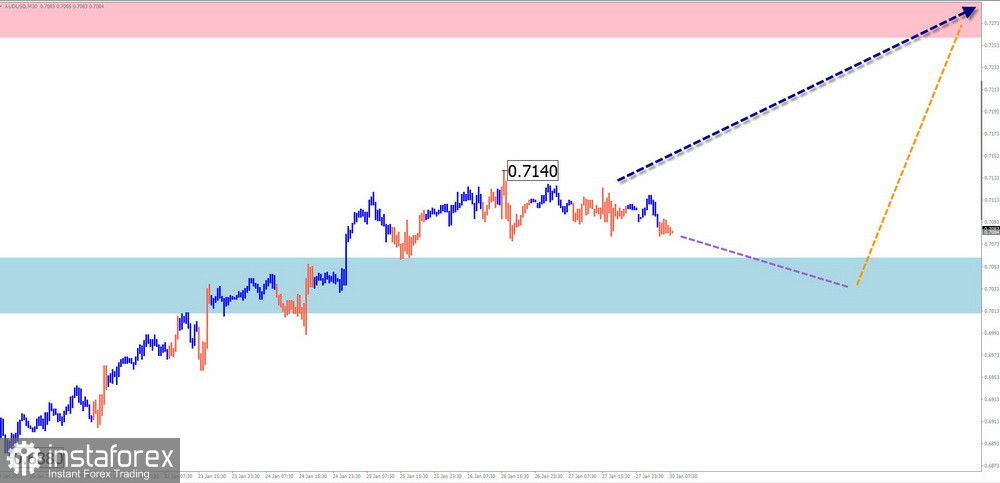
Today AUD/USD is following the trajectory of the incomplete ascending wave initiated on November 13, 2022. Over the past two weeks, the price has broken below a strong resistance level which now serves as support. The pair is now headed for the next target level which still looks incomplete.
Forecast:
The pair is likely to stay in the sideways channel in the next few days. In the second half of the week, the pair may reverse and resume its upward movement. When forming a reversal, the price may well break below the lower boundary of the support zone.
Potential reversal zones
Resistance:
- 0.7260/0.7310
Support:
- 0.7060/0.7010
Recommendations:
Sell: no conditions for selling are seen in the coming week.
Buy: when confirmed reversal signals appear near the support zone.
USD/CHF
Analysis:
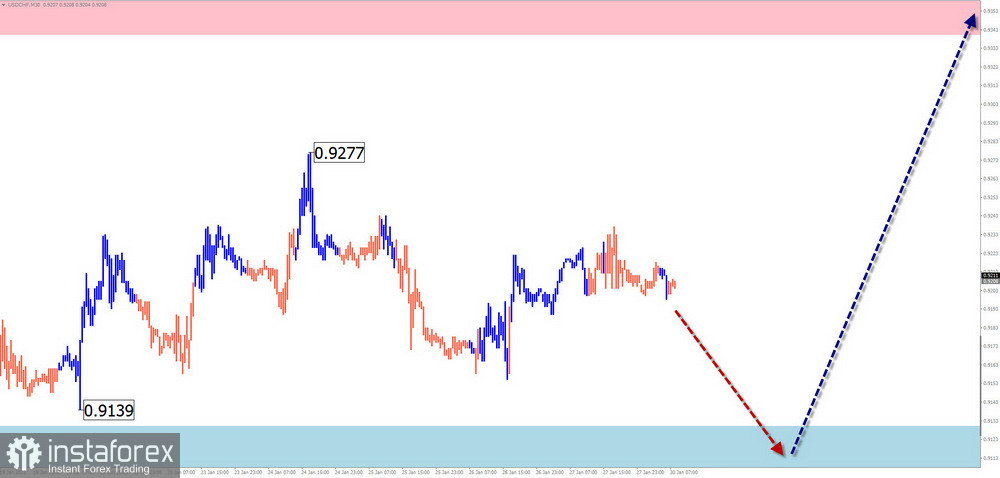
The Swiss franc has been trading in the descending channel for the past six months. The incomplete section of the trend dates back to November 3. The quotes have formed an interim pullback over the past two months. This trend section has not been finished yet.
Forecast:
This week, the pair is expected to trade sideways between the two opposite price zones. The price is likely to move downwards in the first half of the week. It may reverse to the upside closer to the weekend.
Potential reversal zones
Resistance:
- 0.9340/0.9390
Support:
- 0.9130/0.9080
Recommendations:
Sell: it is possible to sell the pair with a fractional lot within a limited session until the first reversal signal is formed.
Buy: when confirmed reversal signals appear near the resistance area.
EUR/JPY
Analysis:
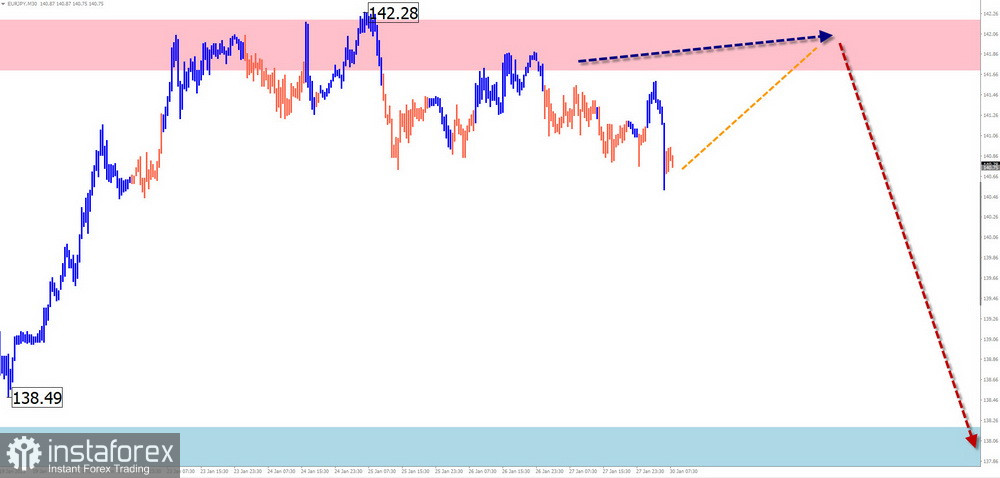
The euro/yen cross pair is treading in accordance with the ascending wave formed in March 2022. The quotes have been forming a correction within a flat channel since September last year. This wave structure is nearing its completion.
Forecast:
The instrument is likely to be trading flat in the coming days. The price is expected to move lower toward the support zone.
Potential reversal zones
Resistance:
- 141.70/142.20
Support:
- 138.20/137.70
Recommendations:
Buy: there are currently no conditions for buying the pair.
Sell: with a fractional lot when relevant signals appear near the estimated resistance zone.
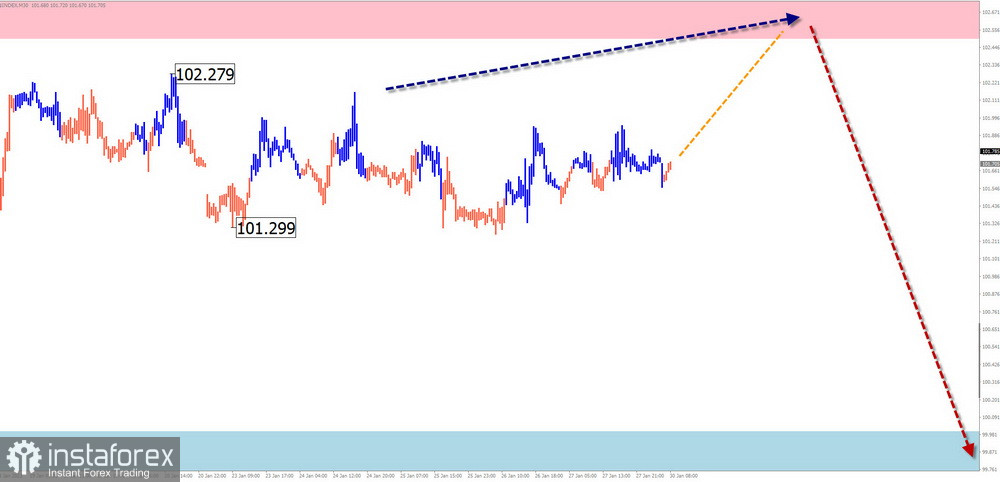
USDX
Brief analysis:
The US dollar index has been losing ground against other majors since late September last year. The current wave is nearing the upper boundary of the target zone. For the entire month, the price has been consolidating below the broken level which now acts as resistance.
Weekly forecast:
This week, USDX is very likely to complete its sideways movement that has been going on for several weeks. After testing the resistance zone, the quote may change its direction and decline toward the support area.
Potential reversal zones
Resistance:
- 102.20/102.70
Support:
- 100.00/99.50
Recommendations
Buy: it is still too early to buy the US dollar.
Sell: after confirmed reversal signals appear near the resistance zone.
Explanation: In simplified wave analysis (SWA), the wave consists of 3 parts (A-B-C). We analyze the incomplete section of the wave for a certain time frame. The expected trajectory of the price is shown by the dotted line on the chart.
Note: the wave analysis does not take into account the movement of the instrument in time!