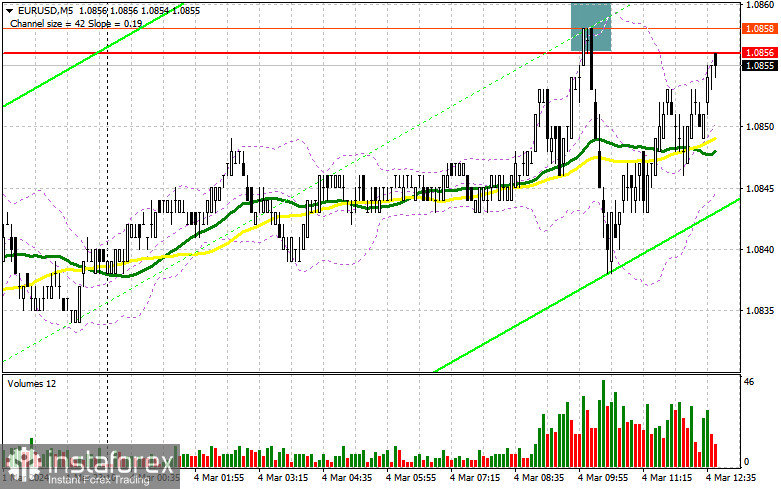
In my morning forecast, I highlighted the level of 1.0856 and planned to make trading decisions based on it. Let's look at the 5-minute chart and analyze what happened. The rise and the formation of a false breakout around 1.0856 led to a sell signal, but due to the low market volatility, the downward movement amounted to about 17 points, and that was it. The technical picture was not revised for the second half of the day.
To open long positions on EUR/USD, the following is required:
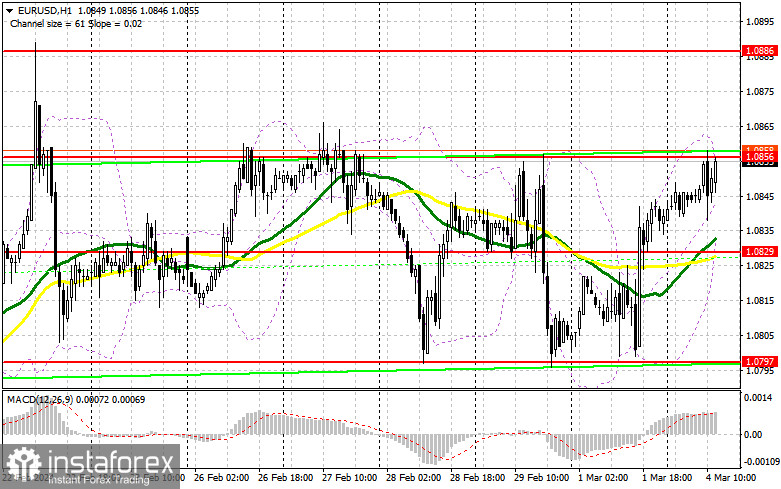
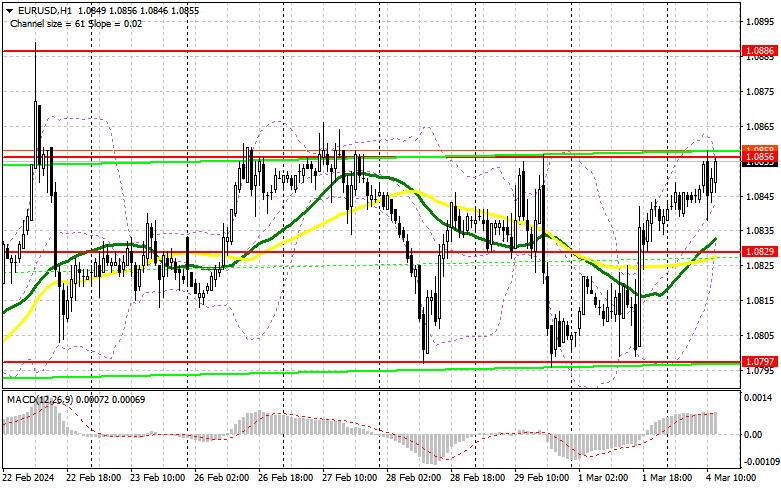
The euro reacted with a slight decline to weak Eurozone data. In the second half of the day, only the speech of FOMC member Patrick T. Harker is expected, and it is unlikely that his statement will differ significantly from the statements of other Fed representatives who spoke last week. For this reason, it is better not to expect high market volatility. Considering that the technical picture has not been revised, I will act similarly to the first half of the day: in case of a decline in EUR/USD and a negative reaction to statements, I will enter the market after the formation of a false breakout near the nearest support at 1.0829. This will be a suitable condition for buying, with the expectation of another pair rising to around 1.0856. Breaking and updating this range from top to bottom will lead to the formation of a new bullish trend, giving you a chance to buy with a jump to 1.0886. The ultimate target will be the maximum at 1.0931, where I will take a profit. In the scenario of a decline in EUR/USD and the absence of activity around the midpoint of the sideways channel at 1.0829 in the second half of the day, pressure on the Euro will increase, leading to a larger decline with the prospect of refreshing 1.0797 – the lower boundary of the sideways channel. I plan to enter the market there only after the formation of a false breakout. I will consider opening long positions immediately on a rebound from 1.0763 with the goal of an upward correction of 30-35 points within the day.
To open short positions on EUR/USD, the following is required:
The bears showed themselves in the first half of the day, but a large sell-off did not happen. Only another unsuccessful consolidation above 1.0856, similar to what I analyzed above, will be a suitable condition for sales with the prospect of refreshing to 1.0829 – the middle of the sideways channel. Breaking and fixing below this range, as well as a reverse test from bottom to top, will give another selling point with the collapse of the pair to around 1.0797, returning the market to the sellers' side. The ultimate target will be the minimum at 1.0763, where I will take a profit. In the event of an upward movement of EUR/USD in the second half of the day, continuing the Friday trend, and the absence of bears at 1.0856 (this level has already worked once today), buyers will maintain an advantage, breaking out of the channel's boundaries. In this case, I will postpone sales until testing the next resistance at 1.0886. I will also sell there, but only after an unsuccessful consolidation. I plan to open short positions immediately on a rebound from 1.0931, with the target of a downward correction of 30-35 points.
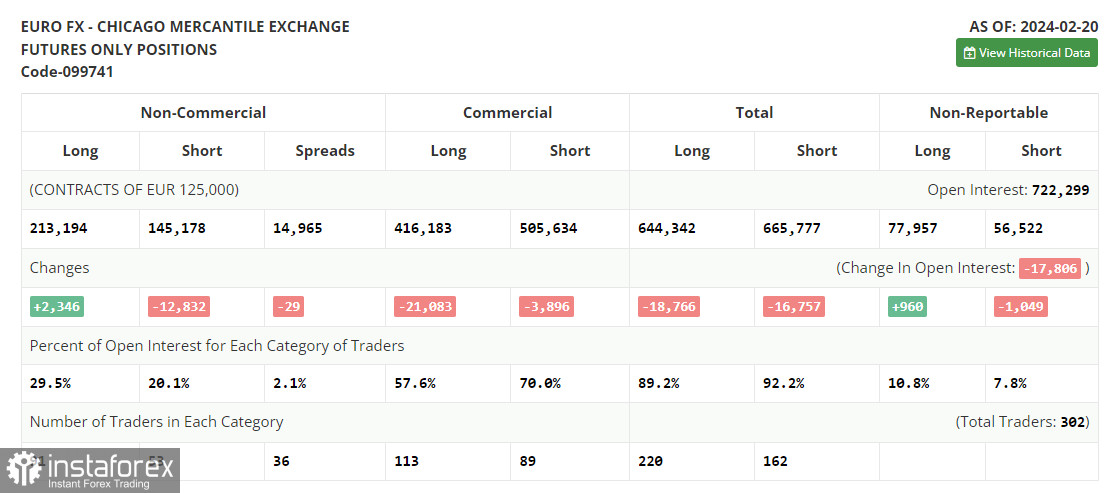
In the COT report (Commitment of Traders) for February 20, there was an increase in long positions and a sharp reduction in short positions. Statements by European politicians had an effect, leading to a slight shift in power dynamics. However, sellers still outnumber buyers, which is a good signal for risk asset buyers – especially against the backdrop of the Federal Reserve's position, which remains quite tough. The COT report indicates that long non-commercial positions increased by 2,346 to the level of 213,194, while short non-commercial positions decreased by a significant 12,832 to the level of 145,178. As a result, the spread between longs and shorts decreased by 48.
Indicator Signals:
Moving Averages
Trading is conducted above the 30 and 50-day moving averages, indicating further growth of the euro.
Note: The period and prices of moving averages are considered by the author on the hourly chart H1 and differ from the general definition of classical daily moving averages on the daily chart D1.
Bollinger Bands
In case of a decrease, the lower boundary of the indicator around 1.0829 will act as support.
Description of Indicators:
- Moving average (determines the current trend by smoothing volatility and noise). Period 50. Marked on the chart in yellow.
- Moving average (determines the current trend by smoothing volatility and noise). Period 30. Marked on the chart in green.
- MACD indicator (Moving Average Convergence/Divergence — convergence/divergence of moving averages). Fast EMA period 12. Slow EMA period 26. SMA period 9.
- Bollinger Bands (Bollinger Bands). Period 20.
- Non-commercial traders - speculators, such as individual traders, hedge funds, and large institutions using the futures market for speculative purposes and meeting certain requirements.
- Long non-commercial positions represent the total number of long open positions held by non-commercial traders.
- Short non-commercial positions represent the total number of short open positions held by non-commercial traders.
- The total non-commercial net position is the difference between the short and long positions of non-commercial traders.