Analyzing Fridays trades:
GBP/USD on 1H chart
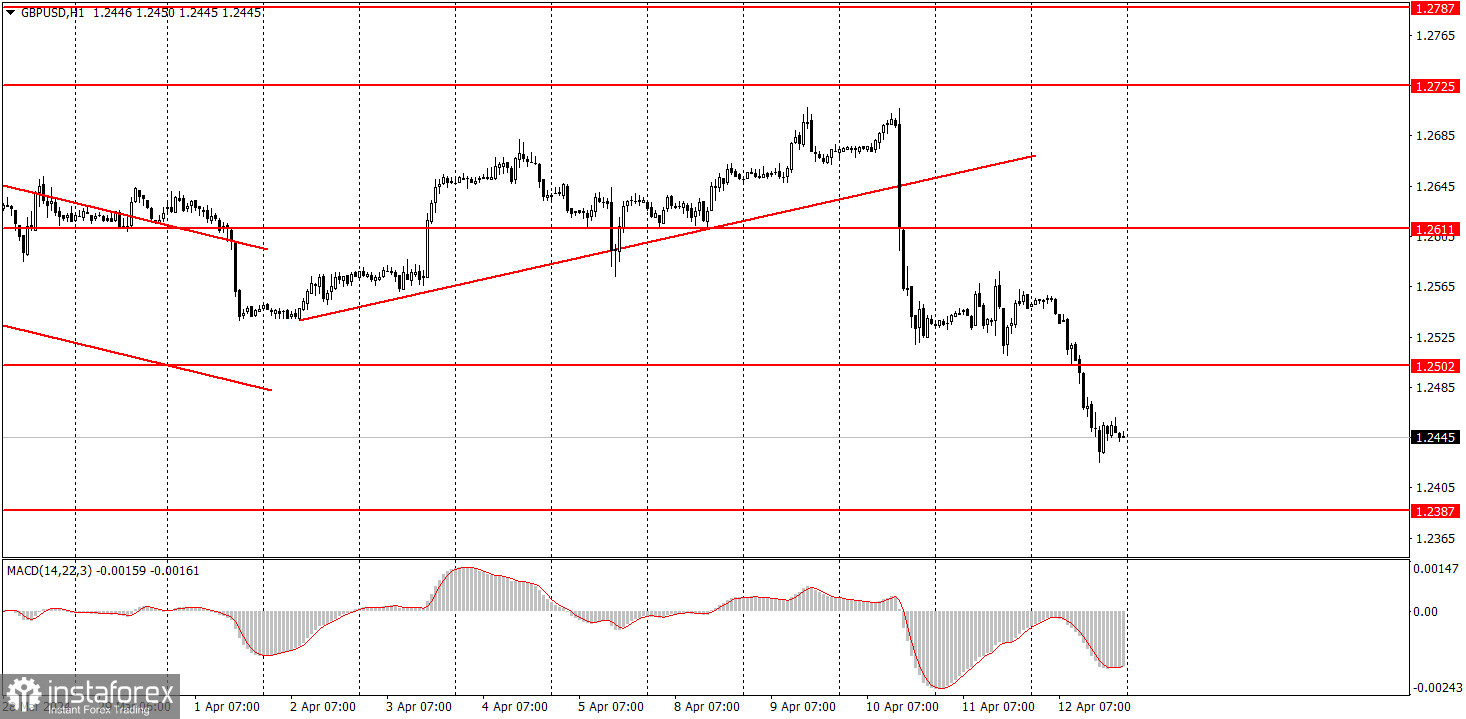
The GBP/USD pair continued its downward movement, finally falling below the level of 1.2502 after four months of trading flat on the 24-hour timeframe. This level had long served as the lower boundary of the sideways channel, so its breakthrough indicates the end of the flat phase. While we wouldn't make such bold conclusions considering the market's reluctance to sell the pound and buy the dollar, the signal of breaking out of the sideways channel is strong and essentially the first time in four months. We fully support the downward movement.
The UK released fairly neutral reports on Friday. The UK economy grew 0.1% in February, which is in line with experts' forecasts, while industrial production grew by 1.1% against expectations of 0%. But take note that the US has released much more important information recently. Therefore, relatively minor reports from the UK did not provide any support for the British pound.
GBP/USD on 5M chart
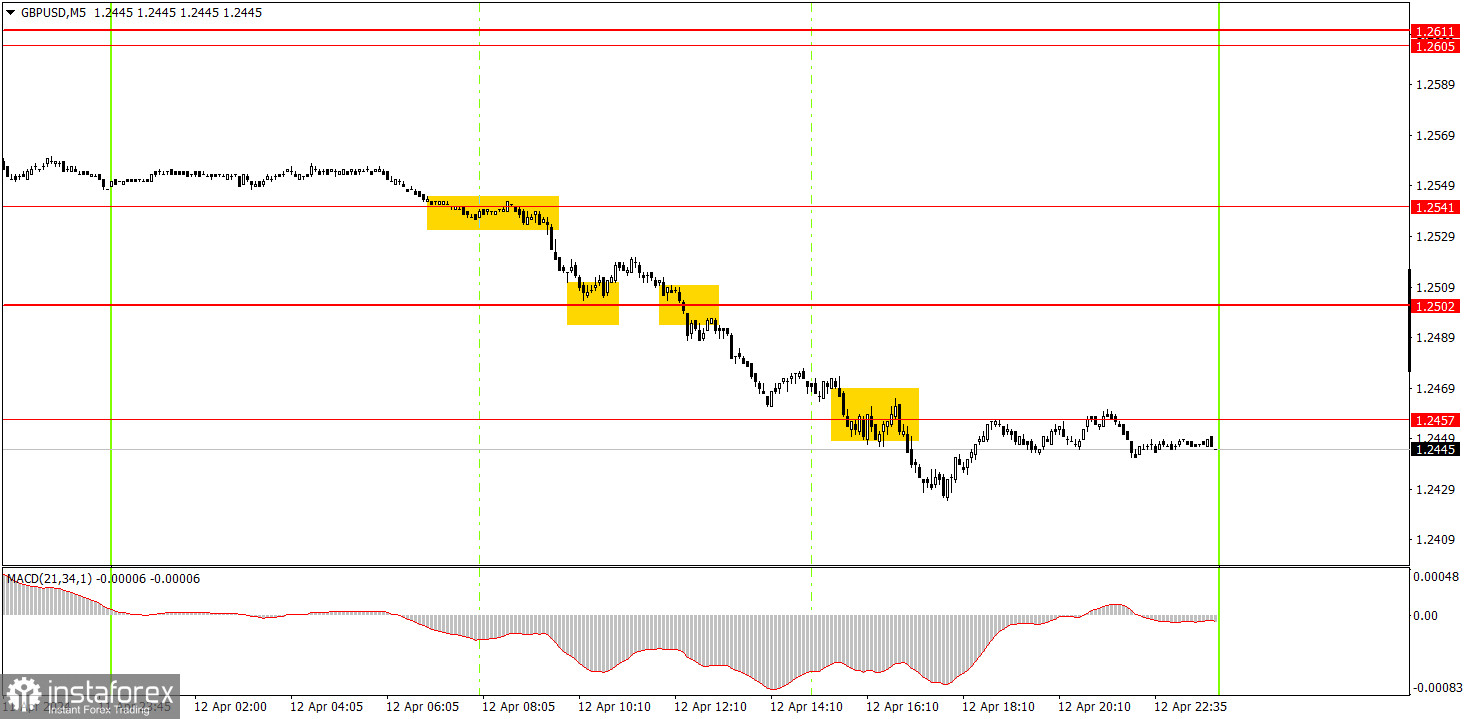
The movement on the 5-minute timeframe was strong enough to trade. The first sell signal formed around the level of 1.2541, indicating a short position. Unfortunately, there was a rebound around the level of 1.2502, after which one could expect the end of the pound's downward movement. Therefore, it was advisable to at least close the short positions. However, for the first time in four months, the price breached this mark, so it was advisable to open new short positions. Subsequently, the pair dropped below the level of 1.2457 and remained below it until the end of the day. Therefore, the second short position should have been manually closed closer to the evening. The profit from the two short positions was about 55 pips, while the loss from the long was around 25 pips.
Trading tips on Monday:
On the hourly chart, the GBP/USD pair finally has real technical grounds to end the 4-month flat phase. After surpassing the level of 1.2502, traders may expect a new downward trend. The fundamental and macroeconomic backdrop continues to support the dollar to a much greater extent than the British one. Therefore, we only expect downward movements from the pair.
On Monday, novice traders can look for sell signals below the level of 1.2502. A correction may follow, but it is unlikely to be a strong movement. If the price does not return above the level of 1.2502 soon, the chances of forming a downward trend will increase even more.
The key levels on the 5M chart are 1.2270, 1.2310, 1.2372-1.2387, 1.2457, 1.2502, 1.2544, 1.2605-1.2611, 1.2648, 1.2691, 1.2725, 1.2787-1.2791, 1.2848-1.2860. No events or reports scheduled in the UK. Meanwhile, the US will release its retail sales report for March. We do not expect a strong market reaction. Overall, the pound may continue to fall.
Basic trading rules:
1) Signal strength is determined by the time taken for its formation (either a bounce or level breach). A shorter formation time indicates a stronger signal.
2) If two or more trades around a certain level are initiated based on false signals, subsequent signals from that level should be disregarded.
3) In a flat market, any currency pair can produce multiple false signals or none at all. In any case, the flat trend is not the best condition for trading.
4) Trading activities are confined between the onset of the European session and mid-way through the U.S. session, after which all open trades should be manually closed.
5) On the 30-minute timeframe, trades based on MACD signals are only advisable amidst substantial volatility and an established trend, confirmed either by a trendline or trend channel.
6) If two levels lie closely together (ranging from 5 to 15 pips apart), they should be considered as a support or resistance zone.
How to read charts:
Support and Resistance price levels can serve as targets when buying or selling. You can place Take Profit levels near them.
Red lines represent channels or trend lines, depicting the current market trend and indicating the preferable trading direction.
The MACD(14,22,3) indicator, encompassing both the histogram and signal line, acts as an auxiliary tool and can also be used as a signal source.
Significant speeches and reports (always noted in the news calendar) can profoundly influence the price dynamics. Hence, trading during their release calls for heightened caution. It may be reasonable to exit the market to prevent abrupt price reversals against the prevailing trend.
Beginners should always remember that not every trade will yield profit. Establishing a clear strategy coupled with sound money management is the cornerstone of sustained trading success.