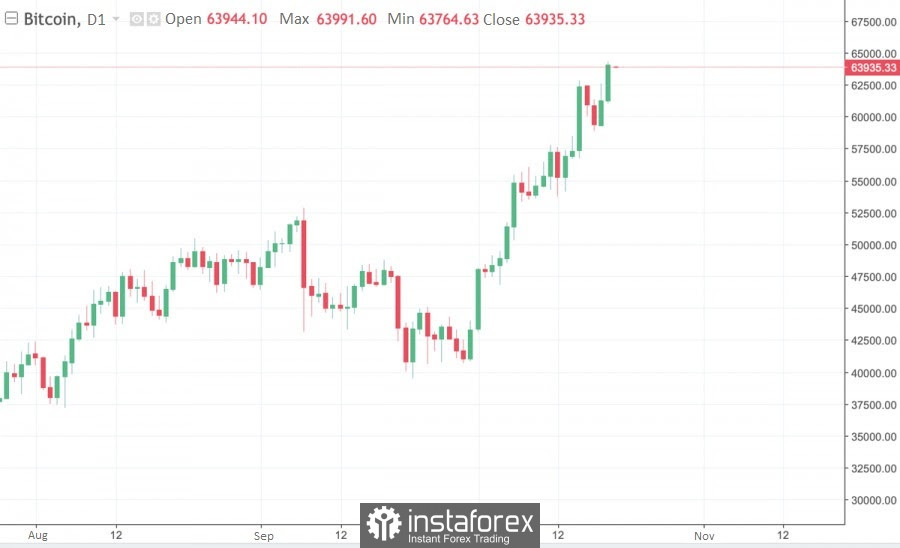
Bitcoin continues to rise, fueled by positive announcements and strong interest from the institutional audience. The coin managed to pass the $61.5k-$63.5k range but is struggling to hold near $64k. The first attempt to consolidate above an important level was unsuccessful, after which the coin dropped to the local support zone. The only mark separating BTC from a new all-time high is $64k. And even despite the closeness of the desired result, bitcoin failed to break through this milestone.
Taking into account the emerging negative factors, it becomes necessary to conduct a technical analysis of the digital asset and answer the question: will bitcoin be able to establish a new absolute price maximum Wednesday, October 20?
Before turning to the horizontal cryptocurrency charts, it is necessary to highlight the current news agenda in order to understand how the market is ready to support certain impulses. The day began with a positive announcement that the newly created ETF started with a result of $1 billion in trading volumes. This is the second best result in history, and therefore the launch of an exchange-traded fund can be considered successful.
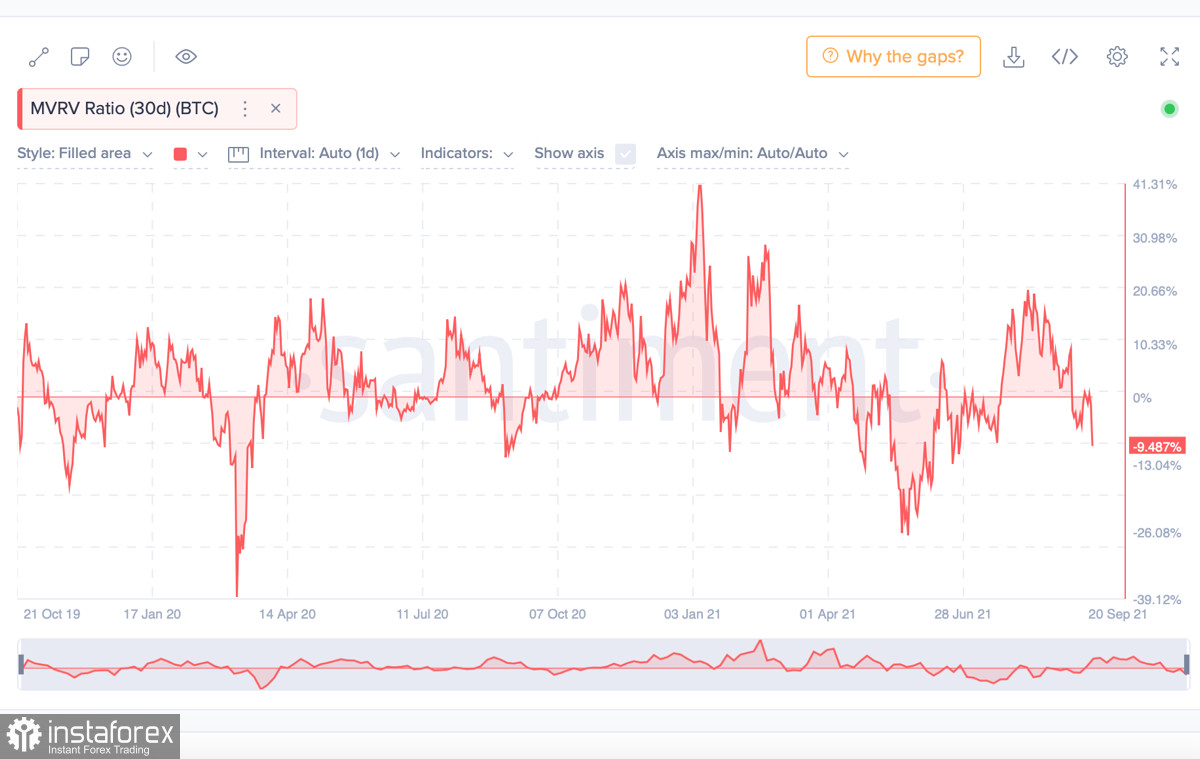
We also highlight a new wave of BTC purchases by players close to local ones, which can be seen from the on-chain metric of the ratio of the realized and market value of bitcoin. The value is near the -10% mark, which indicates that investors are buying cryptocurrency at a loss, which, on the eve of the storming of the historical record, looks like belief in the further growth of the coin. Based on the foregoing, we can be sure that the market is ready to implement bullish impulses and push the price upside.
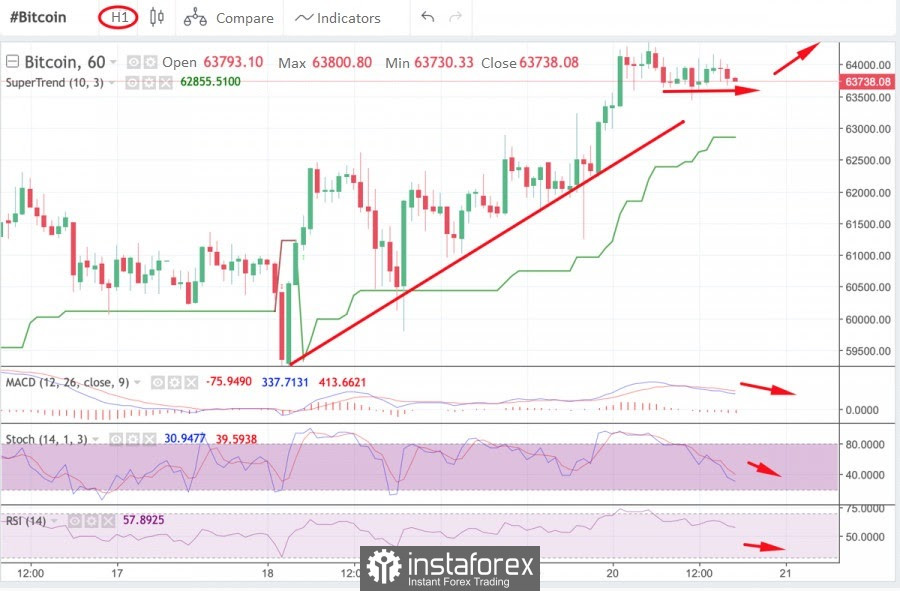
On the hourly chart, the cryptocurrency signals the start of a price stabilization period and a possible pullback to the nearest support area. This can be clearly seen on the horizontal charts, where, after a powerful push up, the price stopped growing and began a sideways movement. The technical indicators of the asset also started to decline, and, most likely, the period of consolidation will pass with a slight decline to the lower border of the support area at $ 63.5k.
At the same time, MACD has completed its decline and is moving sideways without preconditions for a fall or an upward impulse. The relative strength index declined to 60 but managed to slow down the decline and also stabilized sideways. The Stochastic Oscillator is still signaling a strong bearish wave that pushed the decline but is also preparing to start sideways. It is worth noting that all metrics are in safe positions, despite the decline.
In addition, the price moves above the supertrend line, and therefore the current pause in growth is a prelude to further rally to a new historical record. However, to confirm this needs analysis of a wide time range.
*Learn and analyze
MVRV (Market Value to Realized Value) indicator - displays the ratio of the market and realized value of a particular cryptocurrency. This metric gives a more objective view of the current value of the coin and the period of the market. The indicator also displays the results of the movement of coins: if the value is below 0, then the players moved coins with a loss, and if it is above 0, then investors have made a profit from operations with coins.
Relative Strength Index (RSI) is a technical indicator that allows you to determine the strength of a trend (downward or upward), warns of possible changes in the direction of price movement. Thanks to this metric, you can determine in what stage the asset is - overbought or underbought. The optimal mark for this chart is 60 for a bullish trend. It indicates strong demand for the coin and the strength of the current upward momentum. Upon crossing this mark, the coin begins to move towards overbought.
MACD (Moving Average Convergence / Divergence Index) is an indicator that allows you to draw certain conclusions about the trend based on the movement of moving averages and finding the metric values between them. A common bullish signal is the intersection of the white line below the red and bearish, on the contrary, when the white line crosses the red from above, which indicates a downward movement.
Stochastic (Stochastic Oscillator) - the indicator indicates the strength of the momentum of the current prevailing trend. If the indicator is above 80, then the asset can be considered overbought, but if the stochastic is below 20, then this is a signal that the asset is oversold.
Super Trend line is a technical indicator that reflects a bullish (green - a buy signal) and bearish (red - a sell signal) trend on the horizontal charts of a cryptocurrency.
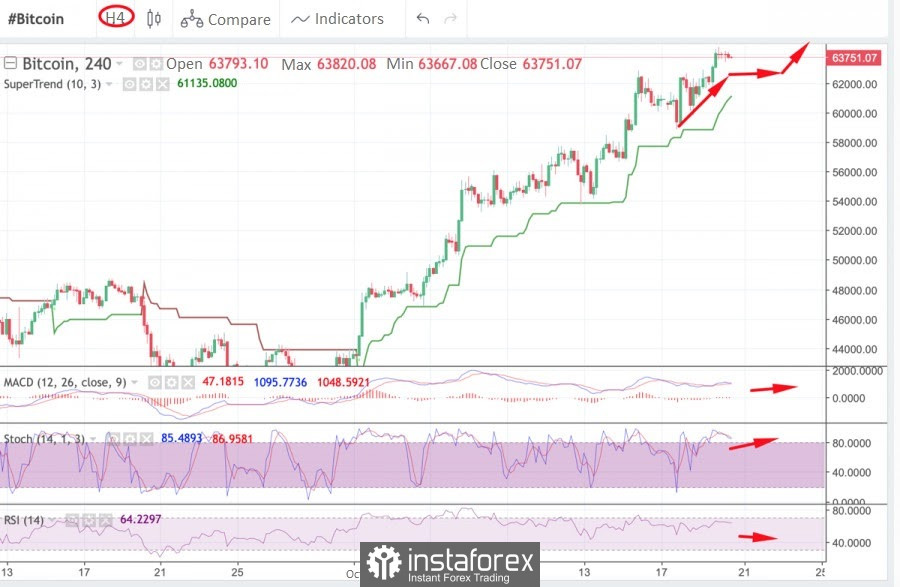
The four-hour chart also shows the prerequisites for the start of the consolidation period. The price is confidently holding in the $63.5k-$ 63.8k area, where a local support zone will be formed before the assault on the final line. Technical indicators, in a manner similar to the hourly chart, move in a flat (sideways movement) with hardly noticeable impulses for growth.
The MACD is moving sideways, failing to fully develop the bullish momentum, which may indicate a local seizure of the initiative by sellers. However, the stochastic is completing the formation of a bullish crossover, so it is likely that the MACD will also reverse and support the upward momentum. The RSI has stabilized and started to move sideways along the 60 mark. The first prerequisites for the beginning are visible on the four-hour chart storming $64k, but the impulses are too timid to rely on such a narrow timeframe.
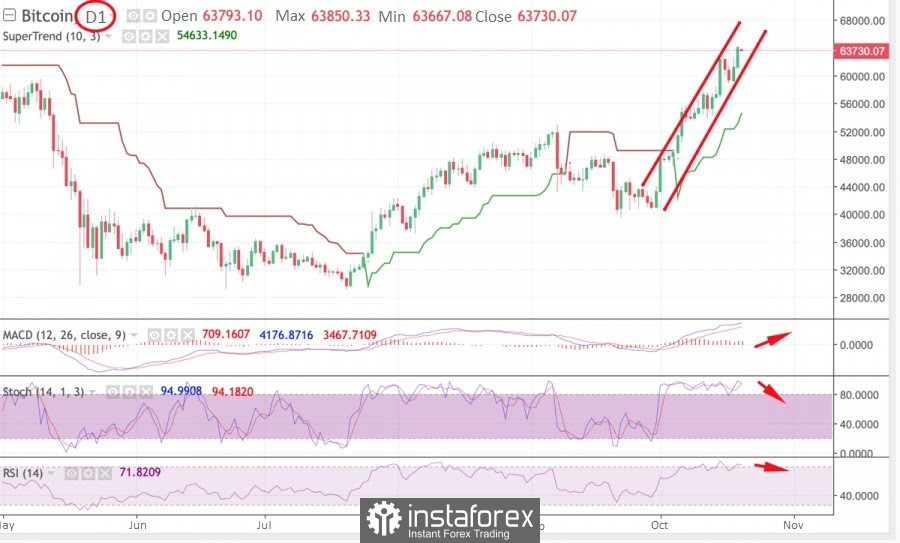
On the daily chart, Bitcoin has continued its upward movement since September 30, and has formed two bullish candles over the past two days, indicating the growing strength of the upward momentum. Despite the presence of positive signals, the overall picture of BTC on the daily chart is rather bearish.
The currency continues to move above the supertrend line, but the metrics responsible for market interest are starting to decline. The Stochastic Oscillator has formed a bearish crossover, which promises a further decline in the price, while the relative strength index is dropping past 70. At the same time, a divergence is formed on the MACD, as the indicator line continues to move confidently upward. This discrepancy can be a prerequisite for a price reduction.
In general, as of 11:00 UTC, Bitcoin is still in a strong upward movement, but at the moment it does not have the necessary market support to successfully overcome the $64k mark due to the high overbought level. However, it is likely that within a few hours, with the implementation of a local stabilization period, the price will break through $64k and set a new record for the value of the cryptocurrency.