EUR/USD 5M
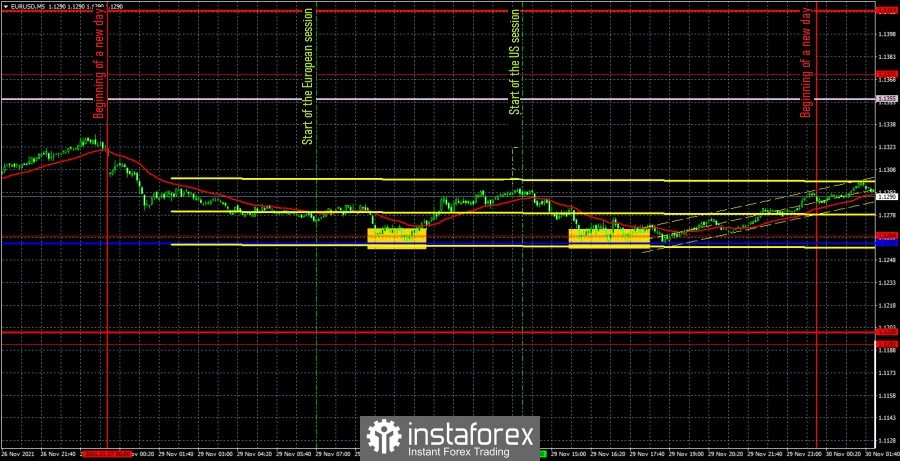
The EUR/USD pair did not show anything interesting on Monday. It should be noted right away that speeches by European Central Bank President Christine Lagarde and Federal Reserve Chairman Jerome Powell were scheduled for Monday. However, they should have taken place only late in the evening, when we recommend leaving the market, since trading on lower timeframes is intraday. Thus, we do not even take into account these events, since they could in no way influence the pair's movements during the day. It should also be noted right away that the overall volatility of the day was about 60 points, but during the European and US sessions, the pair managed to go through only 36 points. Thus, we can assume that the volatility of the day was exactly 36 points, which is very small and does not contribute to active trading and the formation of many signals. In general, the pair traded mostly sideways on Monday and formed two trading signals that traders had to work out anyway, since there were no alternatives and it was not possible to filter them either. The price bounced twice from the extremum level of 1.1264 and the Kijun-sen line, which increased to 1.1259 during the day. Accordingly, it was necessary to open long positions both times. The price managed to go up 22 points for the first time, and then returned to 1.1264, so the deal should have been closed at breakeven by Stop Loss. The second time up, the pair did not pass anything at all, so the deal had to be closed manually in zero profit. As a result, the first trading day of the week did not bring any losses or profits.
EUR/USD 1H

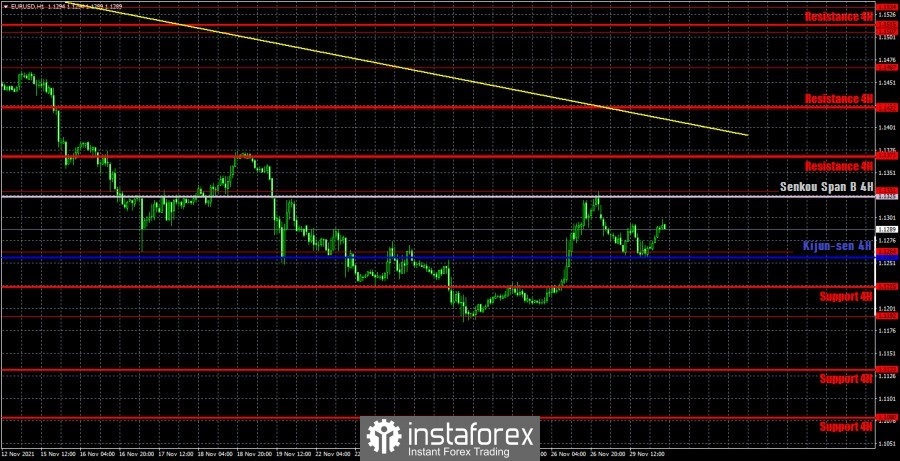
On the hourly timeframe, the downtrend persists, as the pair is still far from the trend line. In the chart above, you can see that the price bounced off the Senkou Span B line, although in fact it is not. The price can only reach this line tomorrow, but the rebound itself is quite remarkable. Just like the rebound from the critical line. Thus, the price is now between two important lines and breaking any of them will allow us to expect movement in the same direction. We highlight the following levels for trading on Tuesday - 1.1192, 1.1264, 1.1331, 1.1371, 1.1422, as well as the Senkou Span B (1.1325) and Kijun-sen (1.1258) lines. The Ichimoku indicator lines can change their position during the day, which should be taken into account when looking for trading signals. Signals can be rebounds or breakthroughs of these levels and lines. Do not forget about placing a Stop Loss order at breakeven if the price moves 15 points in the right direction. This will protect you against possible losses if the signal turns out to be false. The European Union will publish a report on inflation for November, and the US will host speeches by Jerome Powell and Janet Yellen on November 30. Recall that the whole world is now in panic over a new strain of the omicron virus. It is possible that two high-ranking American officials will also comment on this situation. And Yellen may once again declare a possible default on December 15, if Congress does not raise the national debt limit.
We recommend you to familiarize yourself:
Overview of the EUR/USD pair. November 30. The Omicron strain is advancing, but the foreign exchange market is still calm.
Overview of the GBP/USD pair. November 30. The British pound does not respond to the Omicron. Only Boris Johnson responds to the Omicron.
Forecast and trading signals for GBP/USD for November 30. Detailed analysis of the movement of the pair and trade deals.
Analysis of the COT report

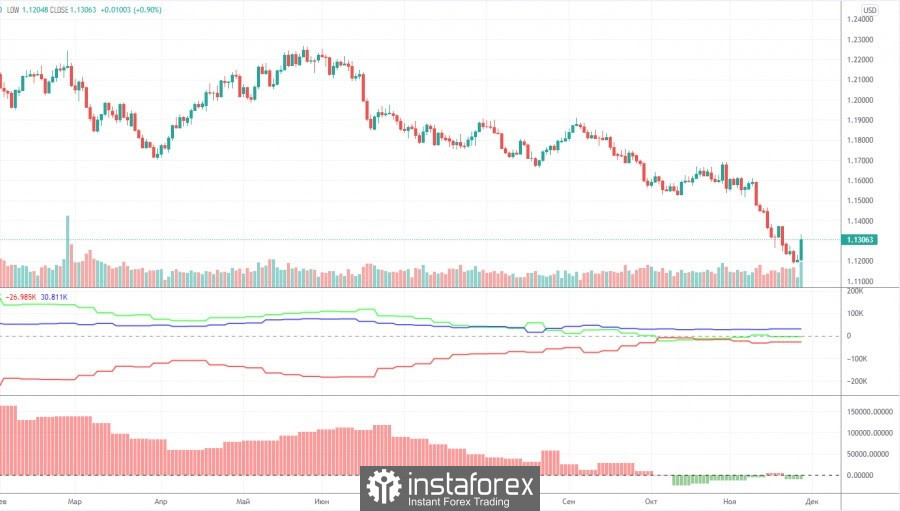
The mood of non-commercial traders changed quite significantly during the last reporting week (November 9-15). A group of non-commercial traders opened 7,000 buy contracts (longs) and 20,500 sell contracts (shorts) during the week. Thus, the net position for professional traders decreased by 13,500, and the mood became more "bearish". It should be noted that the European currency has dropped quite seriously over the past few weeks. But the net position for the "non-commercial" group, starting from October, practically does not change. This is signaled by the green line of the first indicator in the chart above. Almost all this time, it has been near the zero level, indicating the absence of serious changes in the mood of major players. Thus, if the general trend remains the same - over the past ten months, large players have seriously reduced the number of longs and increased the number of shorts, then in the past few weeks nothing of the kind has been observed, and the European currency was still falling. This suggests that what is happening on the market now does not quite correspond to the actions of large players. The second indicator (the net position for professional traders in the form of a histogram) shows that in the last six weeks the mood of traders has become less bearish, that is, in theory, at this time the euro should have been growing, not falling. Thus, if we draw a conclusion only on the basis of the Commitment of Traders (COT) reports, then a further fall in the euro currency is completely unclear.
Explanations for the chart:
Support and Resistance Levels are the levels that serve as targets when buying or selling the pair. You can place Take Profit near these levels.
Kijun-sen and Senkou Span B lines are lines of the Ichimoku indicator transferred to the hourly timeframe from the 4-hour one.
Support and resistance areas are areas from which the price has repeatedly rebounded off.
Yellow lines are trend lines, trend channels and any other technical patterns.
Indicator 1 on the COT charts is the size of the net position of each category of traders.
Indicator 2 on the COT charts is the size of the net position for the non-commercial group.