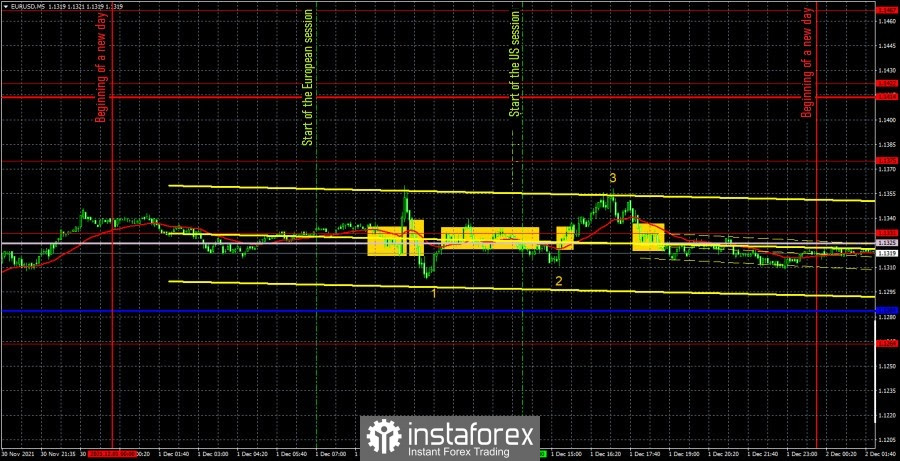
EUR/USD 5M

The EUR/USD pair moved mostly sideways on Wednesday. A surge of emotions was observed only in the middle of the European trading session. Interestingly, no important fundamental events and macroeconomic statistics were planned for this time. However, the markets still found grounds first for long positions, and then for selling the pair, thanks to which the euro first rose by 40 points, and then fell by 60. However, all the most interesting events of the day were already later. The first report on business activity in the manufacturing sector of the European Union was published (figure "1" in the chart), but it was only 0.2 below forecasts, which is absolutely uncritical of this index. More interesting reports came out in the United States. The report from ADP on the change in the number of employed showed an increase of 534,000, which is slightly less than in October, but more than forecasts (figure "2" in the chart). The ISM manufacturing index was published last, which also turned out to be as neutral as possible, as it slightly exceeded the value of last month and slightly fell short of the forecast value (figure "3" in the chart). Although, judging by the chart above, the markets ignored both US reports, since after their publication, a movement began in the opposite direction from the one in which the movement should have begun. As for trading signals, there were a lot of them yesterday, and all were formed near the Senkou Span B line and the extreme level of 1.1331. The first buy signal was promising judging by the way the pair shot up. However, after its formation, only 20 points were passed to the upside, after which the quotes began to fall. However, 20 points was enough to secure yourself and set the Stop Loss to breakeven. According to him, the long position was closed. The next sell signal also turned out to be false, and this time it was not a Stop Loss at breakeven. Although it could not be worked out, since at the time of its formation, the pair had already gone down 50 points. But according to it, traders could still get a small loss. Since neither in the first nor in the second case did the price reach the target level or line, then all the following signals around 1.1331 and Senkou Span B should be ignored.
EUR/USD 1H
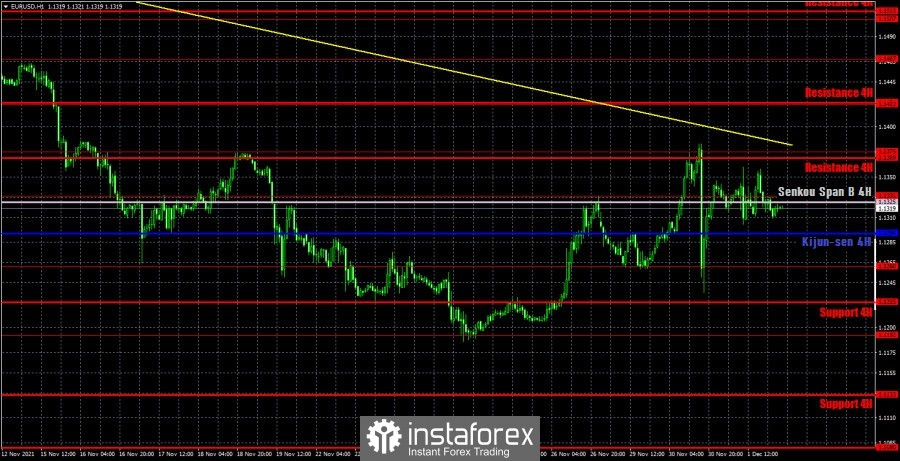
On the hourly timeframe, the downward trend persists, as the trend line is still relevant. The corrective orientation has also been maintained in the last few days, so nothing is changing at the moment. If the pair overcomes the trend line, the trend will change to an upward trend, and the euro will have a good opportunity to form an upward trend. We highlight the following levels for trading on Thursday – 1,1192, 1,1260, 1,1331, 1,1375, 1,1422, as well as the Senkou Span B(1,1325) and Kijun-sen(1,1294) lines. The lines of the Ichimoku indicator may change their position during the day, which should be taken into account when searching for trading signals. Signals can be rebounds or breakthroughs of these levels and lines. Do not forget about placing a Stop Loss order at breakeven if the price moves 15 points in the right direction. This will protect against possible losses if the signal turns out to be false. Only secondary reports will be published in the European Union on December 2, and only a speech by Finance Minister Janet Yellen will be held in the United States. This, of course, is also interesting, but it is unlikely that a strong reaction will follow this event. Thus, today the pair can move with low volatility and mainly sideways.
We recommend you to familiarize yourself:
Overview of the EUR/USD pair. December 2. Jerome Powell amused the markets with his inflation statements for several months. But in the end he told the truth
Overview of the GBP/USD pair. December 2. The Omicron strain can stop the rise in inflation around the world
Forecast and trading signals for GBP/USD for December 2. Detailed analysis of the movement of the pair and trade deals.
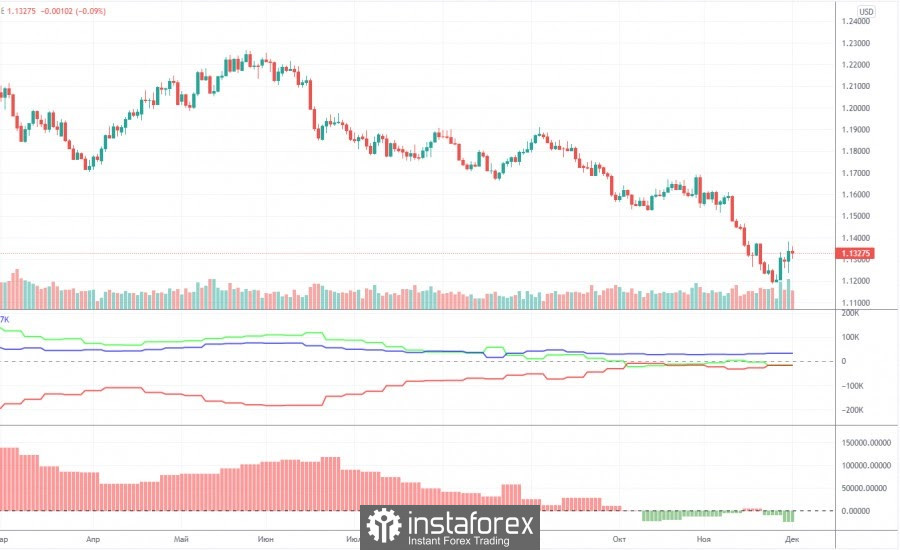
Analysis of the COT report

The mood of non-commercial traders has changed quite a lot during the last reporting week (November 16-22). A group of "non-commercial" traders opened 6,000 buy contracts (longs) and 20,500 sell contracts (shorts) during the week. Almost the same as the week before. However, if you look at the chart above, it becomes clear that in fact the changes in the last two months are not so big. The most important thing to understand is that the net position of non-commercial traders almost does not change. This is eloquently shown by the green line of the first indicator, which spends almost all the time near the zero level. And the zero level signals a neutral mood of traders. Consequently, according to the euro currency, the most important group of "non-commercial" traders is now in the most neutral mood, since the number of open contracts for buying and selling is almost the same – 206,000 versus 229,000. For example, 100,000 more buy contracts were opened in June. Thus, despite the fact that the euro/dollar pair is near its annual lows, commercial traders are in no hurry to continue selling euros. Perhaps because the dollar has already risen quite well this year. Perhaps because traders are waiting for the Fed's last meeting this year, which will show whether Federal Reserve Chairman Jerome Powell is ready to move from words to deeds and start fighting rising inflation by leaps and bounds. We believe that the market is now in a wait-and-see position.
Explanations for the chart:
Support and Resistance Levels are the levels that serve as targets when buying or selling the pair. You can place Take Profit near these levels.
Kijun-sen and Senkou Span B lines are lines of the Ichimoku indicator transferred to the hourly timeframe from the 4-hour one.
Support and resistance areas are areas from which the price has repeatedly rebounded off.
Yellow lines are trend lines, trend channels and any other technical patterns.
Indicator 1 on the COT charts is the size of the net position of each category of traders.
Indicator 2 on the COT charts is the size of the net position for the non-commercial group.