At the end of last week, the pound continued to decline for the most part due to purely technical factors, as well as the uncertainty that continues to accompany everything related to Brexit. Some macroeconomic data was published, but there were very few of them. And most importantly, they clearly did not belong to the category of significant ones. So investors had no choice but to focus on medium and long-term trends in the pound. But they do not promise anything good to the pound. The main issue on the agenda continues to be Brexit. More precisely the content of the commercial part of the divorce agreement. And so far, the UK's positions are clearly losing, and there is simply nothing other than promises and some rumors about progress in the negotiations. But this has been going on for several years. So in the absence of any serious macroeconomic data, or high-profile news regarding Brexit, the pound's prospects look rather frightening.

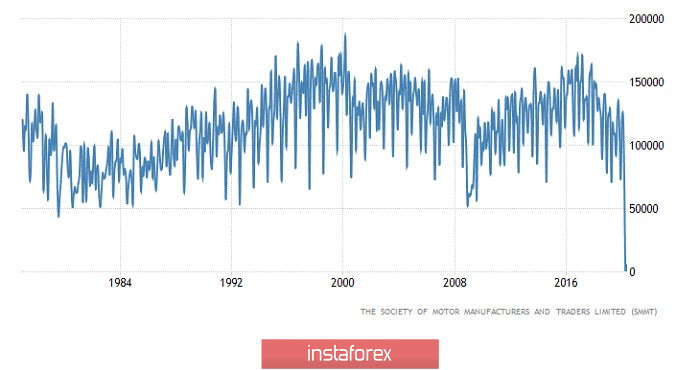
If we talk about statistics, then it is also not impressive, since the British automotive industry continues to lie at the bottom. The decline in car production slowed from -99.7% to -95.4%. Of course, we can say that the dynamics is positive. However, this does not make it easier, since the issue is almost twenty times less than a year earlier. Moreover, they predicted a slowdown in the decline to -78.0%.
Car Manufacturing (UK):
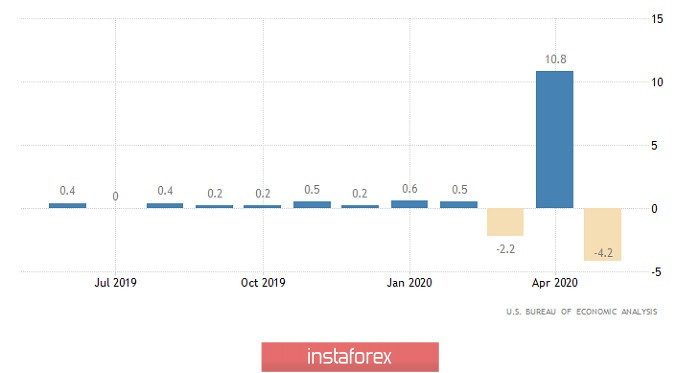
US data turned out to be completely neutral. Personal income decreased by 4.2%. But personal expenses grew by 8.2%. At the same time, one should not forget that personal incomes grew by 10.8% a month earlier while expenses decreased by 12.6%. In general, we see a generally familiar picture, when incomes grow, expenses follow. Another thing is that usually it looks like a faster growth of one of these indicators. But now the situation is not quite ordinary. So instead of outperforming growth, we can see an increase in one indicator, and the decline of another. But you should only start worrying when one indicator grows and the other declines, not alternately, but for two to three consecutive months.
Individual Income (United States):
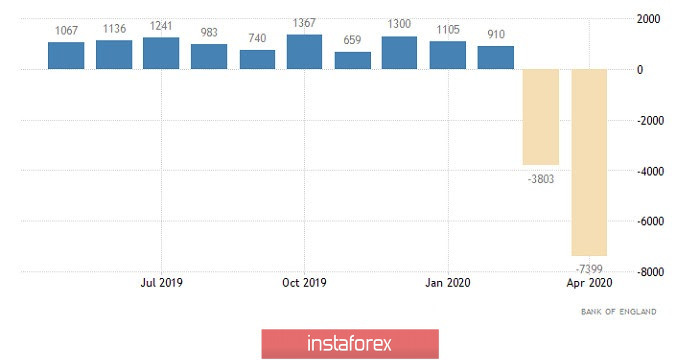
If you look at the macroeconomic data that are published today, then you will see that the pound has no reason to grow. Approved mortgages may be as much as 26.4 thousand, against 15.8 thousand in the previous month. But usually this number varies around 60.0 thousand. Moreover, although the number of approved mortgage loans should increase, the volume of mortgage lending may decrease by 2.0 billion pounds. In addition, the volume of consumer lending should also be reduced by 2.0 billion pounds. That is, we are talking about the full compression of the lending market. And not just about the squeeze, but about the ongoing compression, as last month, consumer lending fell by 7.4 billion pounds. And by another 3.8 billion pounds a month before.
Consumer lending (UK):
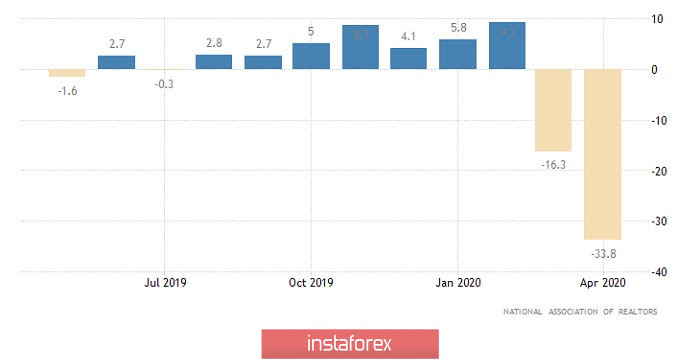
US data can turn out to be much more positive today. Thus, the decline in pending home sales should slow down from -33.8% to -16.2%. In monthly terms, a growth of as much as 18.0% is expected at all. That is, it can be assumed that the US housing market is gradually starting to come to life. These pending transactions themselves simply show how many housing transactions have been carried forward to the next month.
Unfinished Home Sales (United States):
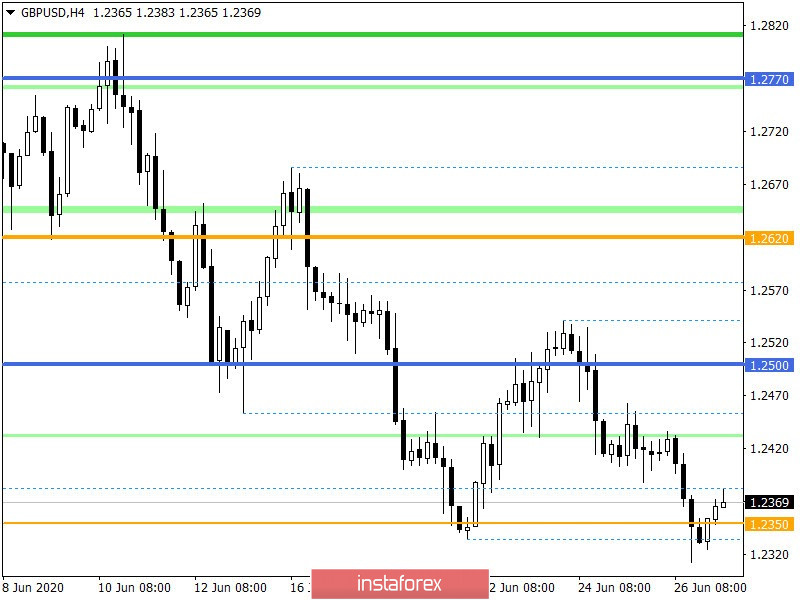
In terms of technical analysis, you can see the next round of short positions, which led to updating the lows and the breakout of 1.2350. Downward interest is undeniable, as is speculative excitement, which has a significant place in the market and leads to chaotic price spikes. Regarding the current fluctuations, a partial recovery of the quote is observed here, winning back a large part of last Friday's decline.
The volatility dynamics is still high, which confirms the fact of speculative activity.
Considering the trading chart in general terms, the daily period, it can be noted that the quote is in a downward spiral from the 1.2770 range, on the basis of which market participants managed to return to the original range.
We can assume that the process of the pullback will experience characteristic pressure in its path within the range of 1.2400, which will ultimately lead to a return to the average level of 1.2350, forming a variable amplitude along it.
From the point of view of a comprehensive indicator analysis, you can see that the indicators of technical tools on hourly and daily periods signal a purchase, due to prices focusing within the 1.2350 level.