To open long positions on EURUSD, you need:
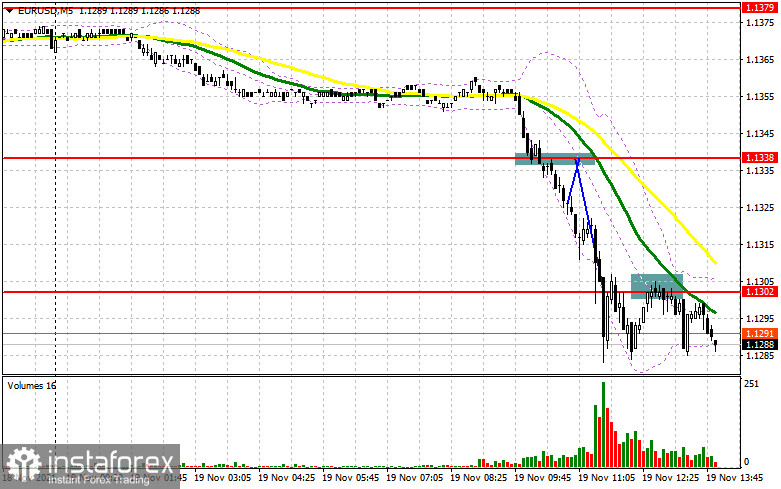
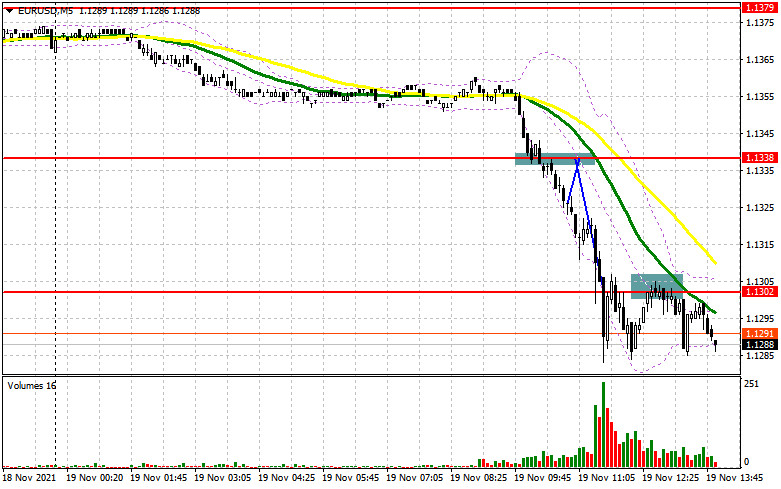
Pressure on the euro has returned after the risk of another lockdown in many European countries. Let's look at the 5-minute chart and figure out what happened. A sharp and unexpected breakthrough of 1.1338 led to a rapid decline in EUR/USD on the stop orders of buyers who expect the pair to continue growing today. However, it was not possible to wait for the formation of a convenient entry point on the reverse test 1.1338 from the bottom up, so I was forced to skip this signal. Already closer to the middle of the day, the bears achieved a consolidation below 1.1302, and the reverse test of this level formed a good entry point further along with the bearish trend. While trading will be conducted below this range, you can count on updating the next lows.
In the afternoon, several representatives of the Federal Reserve System are speaking, but most likely no one will care about them against the background of the news that has flown around the eurozone: Austria has announced complete isolation, and German Health Minister Jens Spahn has not ruled out the introduction of a new lockdown in the country amid the resumption of cases of infection with the virus. It is very problematic to talk about the return of demand for the euro at the end of this week, but for us to see a new upward correction, bulls need to get out of the resistance of 1.1302. Only a reverse test of this level from top to bottom will give an entry point to long positions based on the growth of EUR/USD in the area of 1.1342, where the moving averages are already playing on the sellers' side. A breakthrough in this area with a similar top-down test will lead to an additional buy signal and growth in the area of 1.1379, where I recommend fixing the profits. If the pressure on EUR/USD persists in the afternoon, and most likely it will, as well as hints from FOMC members about the need for more aggressive actions regarding monetary policy, I advise you not to rush into purchases. It is best to wait for the formation of a false breakdown in the area of the next support 1.1267, which the pair is currently targeting. If there is no bull activity there, you can wait for the update of the 1.1222 minimum. But even there long positions — only after unsuccessful consolidation below. You can buy EUR/USD immediately on a rebound from a new low of 1.1193, or even lower - from 1.1155, counting on a correction of 15-20 points within a day.
To open short positions on EURUSD, you need:
The bears achieved their goal by collapsing the euro to weekly lows. Now the task is to update them, which will lead to the complete surrender of buyers. As noted above, as long as trading is conducted below 1.1302, the pressure on the euro will remain. The next formation of a false breakdown at this level forms a signal to open new short positions in the continuation of the downward trend. The primary goal will be the support of 1.1267, which is the above minimum. A breakdown and a test of this area from the bottom up will increase pressure on EUR/USD and lead to the demolition of several buyers' stop orders. This will open the way to new levels: 1.1222 and 1.1193. There I recommend fixing profits on short positions. Under the scenario of euro growth during the American session and the absence of bear activity in the area of 1.1302, I advise you to postpone sales until the next resistance test - 1.1342, where the moving averages are playing on the sellers' side. But even there, it is best to open short positions after the formation of a false breakdown. The best option for selling EUR/USD immediately for a rebound will be a maximum in the area of 1.1379. You can count on a downward correction of 15-20 points.
The COT report (Commitment of Traders) for November 9 recorded a reduction in short positions and a slight increase in long ones, which led to the return of a positive delta. The fact of high inflationary pressure in the US continues to support the US dollar, as many investors are counting on an earlier increase in interest rates by the Federal Reserve next year and are already winning back the market in this direction by buying the US dollar. The statements of the representatives of the central bank, which have been heard recently, only confirm the expectations of market participants. At the same time, the president of the European Central Bank, Christine Lagarde, confidently insists that the ultra-soft monetary policy will not change even next year – this puts some pressure on buyers of risky assets who were counting on a more active recovery of the euro. In the near future, we will get acquainted with important data on retail sales in the United States and the unemployment rate in the eurozone, which will shed light on further actions by regulators to stimulate the economies of their countries. The latest November COT report indicated that long non-commercial positions increased from the level of 191,496 to the level of 192,544, while short non-commercial positions decreased from the level of 197,634 to the level of 188,771. At the end of the week, the total non-commercial net position became positive and amounted to 3,773 against -6,138. The weekly closing price decreased quite slightly, to the level of 1.1587 against 1.1599.
Signals of indicators:
Moving averages
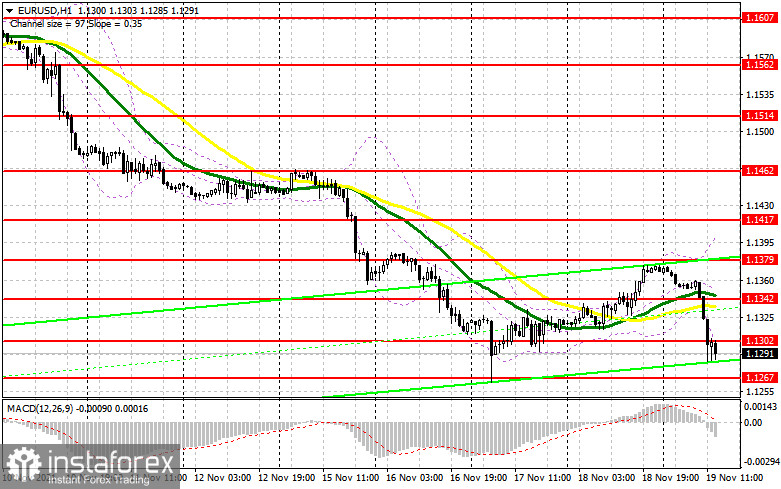
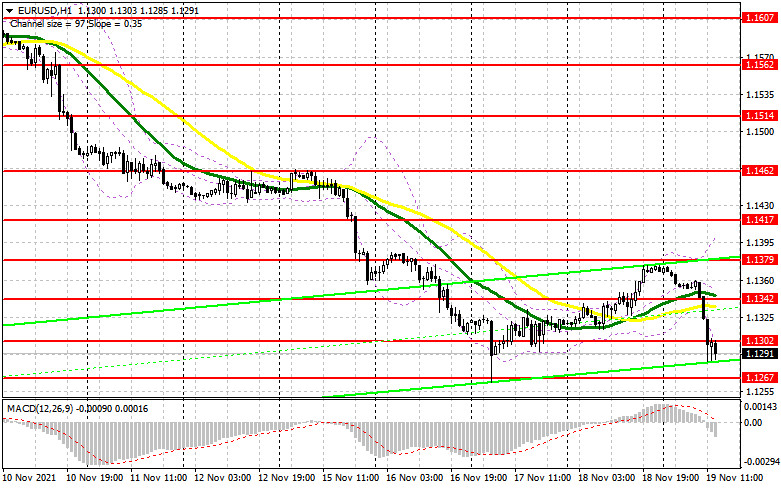
Trading is below 30 and 50 daily moving averages, which indicates the resumption of the bear market.
Note. The period and prices of moving averages are considered by the author on the hourly chart H1 and differ from the general definition of the classic daily moving averages on the daily chart D1.
Bollinger Bands
In case of growth, the upper limit of the indicator around 1.1405 will act as resistance.
Description of indicators
- Moving average (moving average determines the current trend by smoothing out volatility and noise). Period 50. The graph is marked in yellow.
- Moving average (moving average determines the current trend by smoothing out volatility and noise). Period 30. The graph is marked in green.
- MACD indicator (Moving Average Convergence / Divergence - moving average convergence/divergence) Fast EMA period 12. Slow EMA period 26. SMA period 9
- Bollinger Bands (Bollinger Bands). Period 20
- Non-profit speculative traders, such as individual traders, hedge funds, and large institutions that use the futures market for speculative purposes and meet certain requirements.
- Long non-commercial positions represent the total long open position of non-commercial traders.
- Short non-commercial positions represent the total short open position of non-commercial traders.
- Total non-commercial net position is the difference b