Top 10 candlestick patterns for successful trading
Let’s get to know the most popular candlestick patterns. Find out how your trading can benefit from them!
To make steady profits in trading, market participants apply a plethora of methods and techniques. Among this variety, market analysis by means of candlestick patterns is recognized by traders as their favorite and the most reliable method. The secret behind such popularity is simplicity of its application. To grasp the point about the market behavior, you need to learn how to decipher popular candlestick patterns. Now let’s gain an insight into the principles of a candlestick’s composition.
Definition of candlestick pattern
A candlestick is a separate bar, representing price moves of an asset in a particular interval.
A candlestick pattern or a candlestick chart consists of either the only Japanese candlestick or their cluster which mirror current market conditions and provide a summary of ongoing trading activity.

Japanese candlesticks enable a trader to make fully comprehensive market analysis that makes it one of the most popular non-indicator methods of trading on Forex. On top of that, this method is also one of the simplest. It is enough to recognize a particular candlestick pattern on a chart that suggests opening buy or sell positions.
In essence, a candlestick chart is one of the basic analytical tools. Once you grasp the principle of a candlestick chart composition, you will be able to predict a further market trend with pinpoint accuracy.
Top 10 candlestick patterns
- Hammer
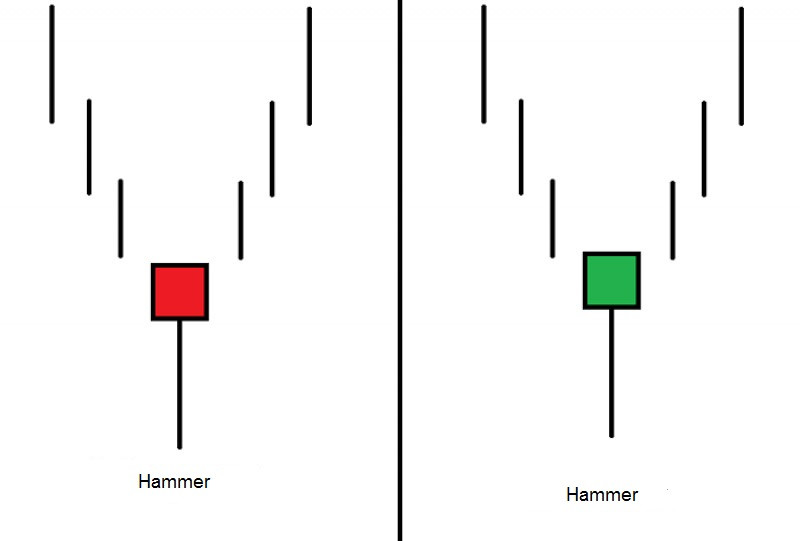
It is a single candlestick pattern. It has a body which is at least twice smaller than the lower shadow. The upper shadow is either tiny or missing.
The pattern is formed at the lower point of a downtrend, thus indicating market weakness. A breakout of the pattern’s high signals the right time to buy a currency pair. It makes sense to place a stop loss a bit lower than the candlestick’s low. A stop loss is a protective order which is set to close a trade automatically with a view to cutting losses.
2. Shooting star
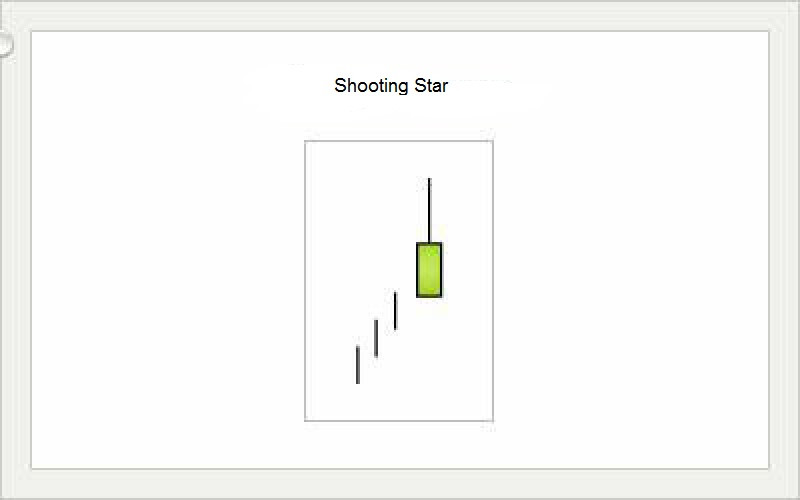
This patterns looks like the Hammer in a mirror. This single candlestick pattern is found at the peak of an uptrend and signals the bearish trend reversal soon.
The Shooting star consists of the bearish candlestick with a long upper shadow and a tiny or no lower shadow. Here, the section between the pattern’s high and its opening price should be twice longer than its body.
3. Bullish and Bearish engulfing
Both are two-candlestick patterns which consist of two candlesticks facing opposite directions and look like in a mirror. In the Bullish engulfing, the descending candlestick means a trend continuation and body of the ascending one engulfs the body of the previous one in full. The Bullish engulfing indicates that bulls are holding the upper hand over bears. Alternatively, the Bearish engulfing appears at the top of an uptrend and sets the stage for a bearish price reversal.

4. Harami
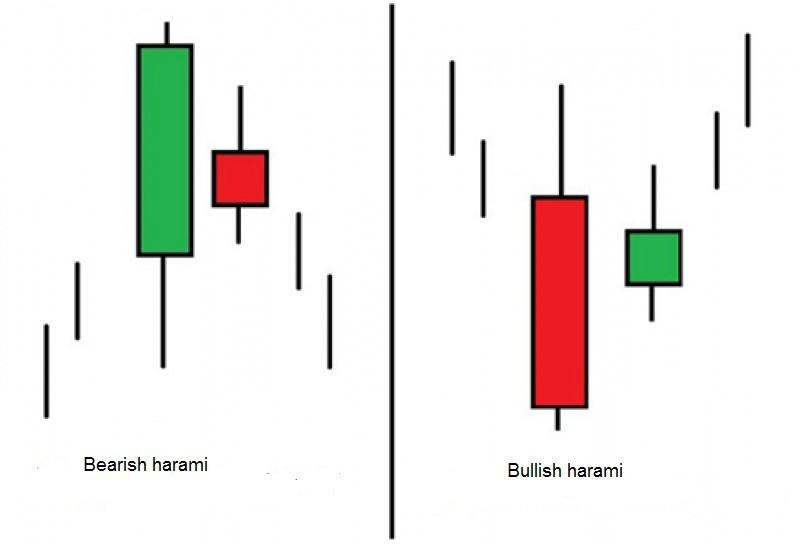
The Harami pattern predicts a trend reversal and comes into being at the top of an uptrend or at the bottom of a downtrend. Harami in Japanese translates as pregnant. This pattern resembles a pregnant woman because the first candlestick with a large body completely encloses the second small candlestick.
This is a two-candlestick pattern. The first one reflecting the ongoing trend and facing the same direction has a large body. It entirely dominates the second candlestick with a small body.
When the high of the Bullish harami is broken, this is viewed as the signal to open long positions. Conversely, short positions should be opened after the low of the Bearish harami is broken.
5. Piercing line
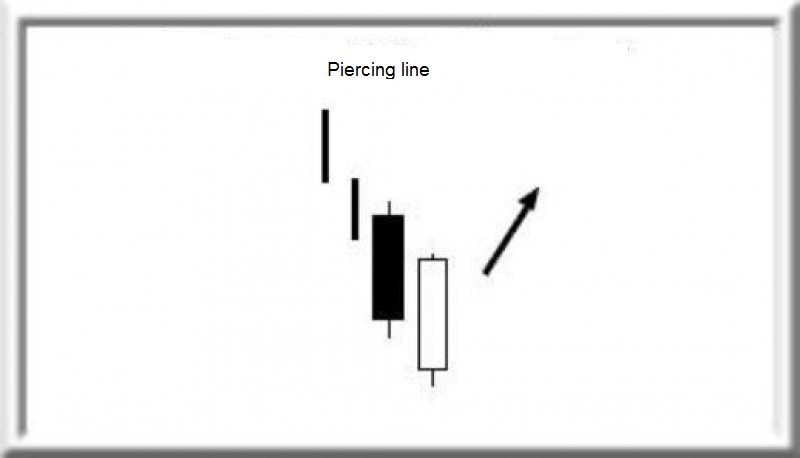
It is one of the most popular trend reversal patterns. This two-candlestick pattern suggests a potential bullish reversal. Commonly, the Piercing line involves two long-bodied candlesticks with the second one opening lower than the previous one. The first candlestick is bearish and the second one is bullish.
6. Morning star
This three-candlestick pattern looks like a star and signals a trend reversal. The first long-bodied candle indicates the ongoing downtrend. The short middle candle comes second. The third long candle is bullish. In practice, this sequence of candles is interpreted as follows. First, sellers are setting the tone, then they are losing control, and eventually, the market is turning bullish.

7. Evening star
The Evening Star is the pattern opposite to the Morning Star. It consists of three candlesticks. The Evening Star starts with a large bullish candle. The small Doji star is in the middle which is followed by a clearly bearish candle. This means that the bearish trend reversal is in place.
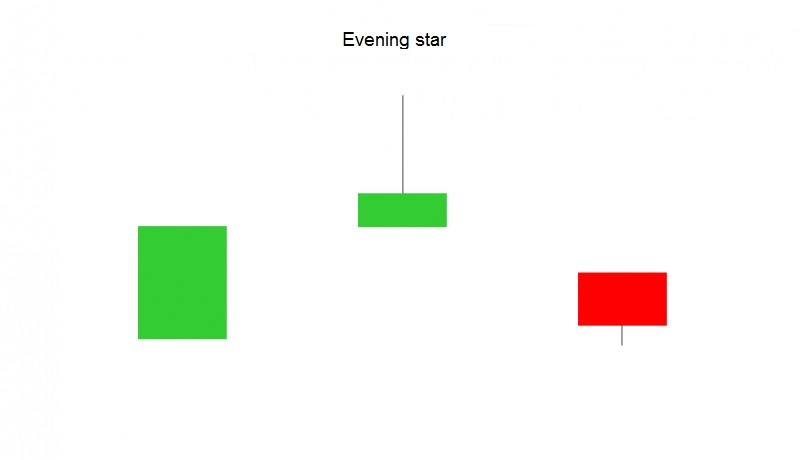
If you recognize this pattern on the chart, you should close short positions. Long positions will be appropriate not until a breakout of the third candlestick’s high. The Evening star proves uncertain market sentiment and signals neither a trend reversal nor a trend continuation. This pattern frequently appears prior to a release of high-impact economic data.
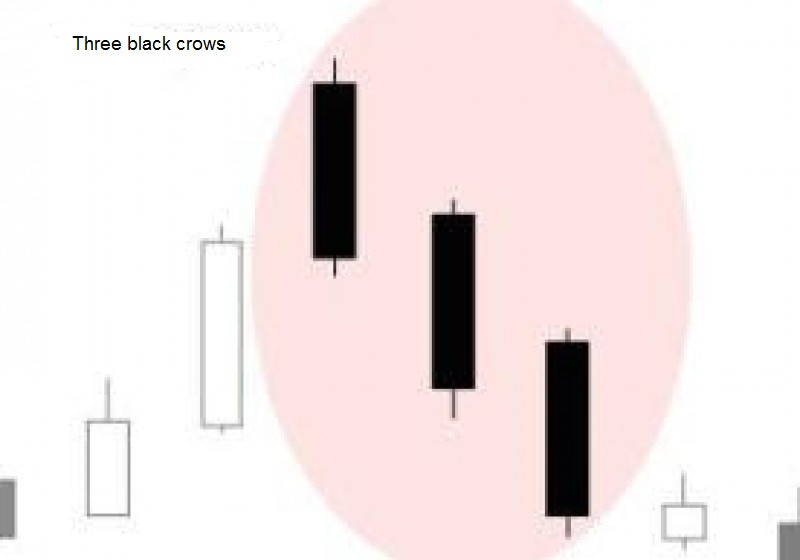
8. Three Black Crows is a triple candlestick pattern meaning that an asset’s price is about to enter an uptrend. It consists of three bearish candles unequal in size. Three consecutive long-bodied candlesticks open within the real body of the previous candle and close lower than the previous candle. The first candle predicts a reversal of an uptrend and the other two candles confirm the bearish market sentiment.
If you identify this combination on the chart, you may be sure that the market will turn bearish in the near future. In most cases, this pattern suggests that a trader should plan short positions.
9. Doji
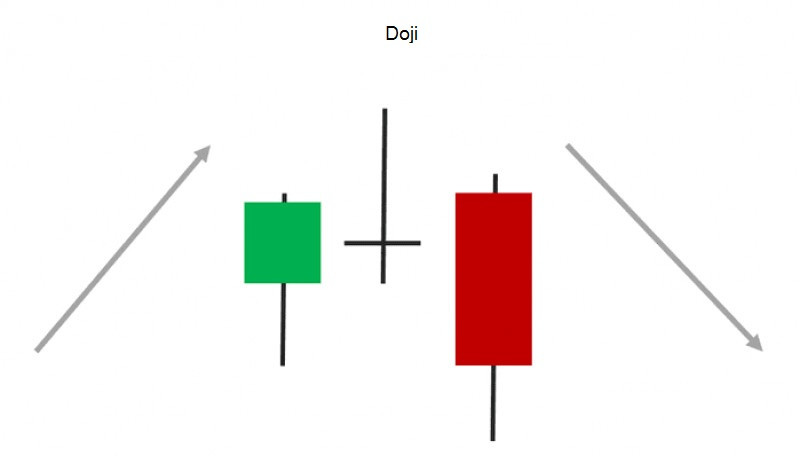
It is a single candlestick pattern that appears either at the peak of an uptrend or at the bottom of a downtrend or in the middle of an ongoing trend. Doji candlesticks look like a cross, inverted cross or plus sign. Doji patterns come in three major types: gravestone, long-legged, and dragonfly. A classical Doji has a tiny body between long upper and lower shadows. It means indecisive sentiment or a tug-of-war between bulls and bears.
10. Inside bar
This pattern springs up during a market consolidation. The high and low of this inside bar is completely contained within the range of the previous candle. Visually, this pattern may look like the Bullish or Bearish harami. However, the main difference of the Inside bar is that analyzing the chart, the highs and lows are of prime importance regardless of the candle’s body.

Before using candlestick patterns in the real currency market, we strongly recommend you practice analyzing these patterns in a demo account with InstaForex.
Conclusion
In this article, we have introduced you into a few among a myriad of popular candlestick patterns. If you are interested in this kind of market analysis, welcome to a special section on the InstaForex website to learn more.
Notably, candlestick patterns are an extremely important tool of forex analysis. So, every trader needs this essential skill of reading a candlestick pattern. Understanding Japanese candlesticks enables a trader to determine the ongoing trend and predict a further market development. So, it will be much easier to make the right trading decision.


 Back to articles

