


When dividing a price chart into segments of a certain size, some patterns can be observed there. Such patterns were named fractals by Bill Williams.
This article will explain what fractals are, how they are formed on a chart, and how such patterns can be used in trading. There are a lot of variations of this indicator, so everyone can choose the most suitable one.
You can learn more about different trading strategies and their basic concepts by reading the article "what is trading."
What are fractals
Indicators by Bill Williams stand out among all other analytical tools. Their creator is a successful trader with vast experience in financial markets.
His theory and trading algorithm are based on the idea that the markets are chaotic. Price charts of various assets consist of a random set of elements. However, when combining them into a whole, some patterns can be observed.
It is impossible to understand and predict the financial markets, so we need to focus on the psychological aspect - the behavior of traders.
Bill Williams' theory became so popular that thousands of traders all over the world still study his system and use it when trading. His indicators are included in the standard set of analytical tools of the most well-known and popular trading platforms.
Here are the main Williams’ indicators:
- The Alligator indicator is one of the most famous tools by Williams. It is a trend indicator based on three moving averages with different periods. The moving averages interact with each other, providing signals to the user.
- The Awesome Oscillator (AO) works similarly to the MACD indicator. It is plotted as a histogram and can provide different types of signals, such as zero crossings, divergences/convergences, highs/lows, and the saucer pattern.
- The MFI (Market Facilitation Index) is an indicator that takes into account both asset price fluctuations and changes in trading volumes. Based on these calculations, bars of different colors are displayed in a separate window. Often this indicator is used to confirm signals from other indicators.
- Fractals are areas on the chart which highlight short-term peaks or troughs that may predict a potential reversal of the current trend. We will discuss this indicator in more detail later on.
How are fractals used in trading?
So, let us examine in more detail what fractals are and how they can be used in trading. Fractal patterns are displayed on candlestick charts. These patterns consist of at least five candles.
There are two main variations of this indicator: "fractal high" and "fractal low". In the first case, the middle candle of the selected range is closed above the others, in the second case - below the neighboring candles.
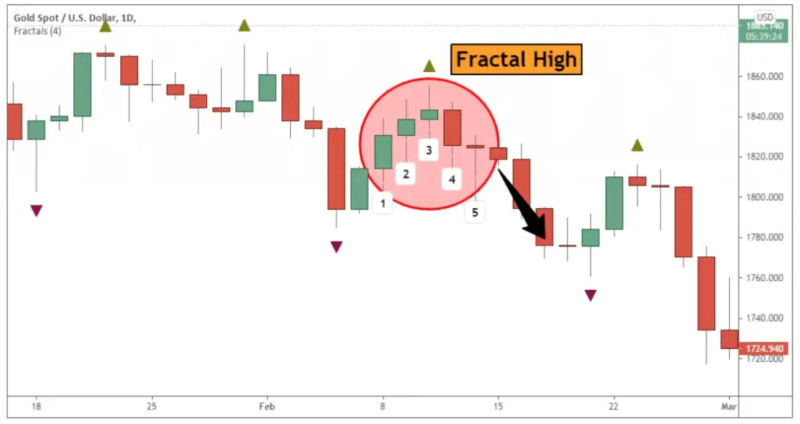
Often, the formation of a fractal high is preceded by the appearance of two candles, each of which is slightly higher than the previous one. After its formation, the opposite pattern is observed - the subsequent candlesticks gradually decrease.
After such a pattern is formed, short positions can be opened, because the market trend is reversing downwards.
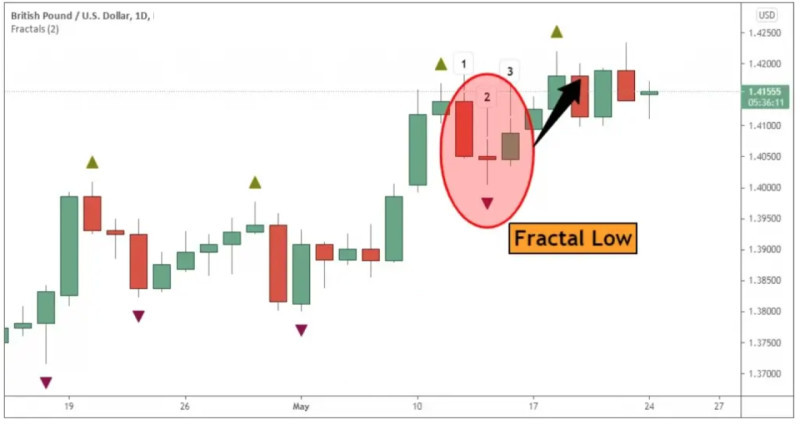
During the formation of a fractal low, two consecutively declining candlesticks precede it. After the formation of a local trough, the following candles gradually increase as they close.
Such combinations indicate a potential bullish reversal and can be considered a buy signal.
The key requirement for the formation of a fractal trading is that the central candle should be above or below the surrounding candles. Fractals are formed all the time on a chart, so a single candle may be a part of two patterns at the same time.
In order to use these patterns correctly, you must always wait for the last candle to close. If the price does not make any unexpected turns at that moment, the fractal can be considered fully formed.
True and false fractal patterns
The names of fractal patterns can be somewhat confusing to traders. Let us take a look at the terms and try to distinguish them.
Low fractals are frequently called "bullish", and high fractals are called "bearish", which might seem contradictory.
There is a reason for that. When a fractal high is formed, the pattern contains a local high compared to the two preceding and two following candlesticks.
Such a pattern indicates that the asset is declining, which is why it is called a "bearish" fractal. After its formation, you may open short positions.
Conversely, a fractal low has a price low compared to the two candles that precede it and the two candlesticks that follow it.
Therefore, this pattern marks a bullish reversal. Long positions may be opened after the formation of a low fractal.
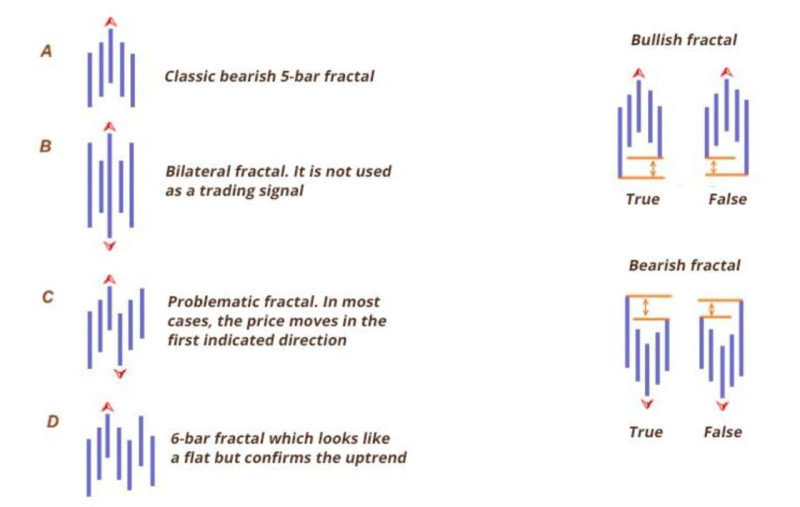
It is also necessary to distinguish between true and false fractals. In false fractal patterns, the asset is unable to overcome the local high or low of the pattern.
There are many rules used to distinguish between true and false patterns. In general, any deviation from the classical shape should alert the trader.
Probably the easiest way to determine whether a fractal pattern is true or not is to compare the lengths that connect the points forming the pattern with each other. There are three points in total: bearish patterns have two points at the bottom and a top, while bullish patterns have two tops and a bottom.
In the first case, the model is proved to be true, if the distance between the two lows is less than the distance from the high to any of the lows. In the second case, the distance between two highs should be less than the length of the segment from the low to any of the highs.
How to understand fractal patterns
There are several important points concerning the formation of fractal patterns on the chart that should be taken into account. Such patterns do not always have the same shape and may deviate from the typical structure to some extend.
- Initially, the creator used the bar chart to search for patterns. Therefore, if candlesticks are used, the height of all candlesticks must be taken into account, including their shadows.
- Fractal patterns do not have to be exactly five candlesticks or bars, as this is the lowest required amount of candlesticks. It can also be an even number, in which case the central candle is the later peak or trough.
- Furthermore, the peaks following the middle candle should not be always declining gradually.
- For a bearish pattern, the high and the low points of the middle candle should not necessarily be higher than the other candlesticks in the pattern. The trader is only interested in the highs of the fractal high, and vice versa.
- It should be taken into consideration that the pattern in question cannot be formed at the very edge of the chart due to its specific features. The full pattern requires the formation of two candlesticks after the central peak or trough.
- Furthermore, if the two candlesticks within a patterns have highs at the same level, the second peak will not be taken into consideration when the fractal is used. The same rule applies to lows in a bullish fractal.
Setting up and tweaking fractal indicators
Fractal indicators are very popular among users and can be found in most trading platforms.
Here is an example of how to install and set up a fractal indicator on the MetaTrader trading platform. The fractal indicator is one of the platform's default indicators, so you can start using it as soon as MetaTrader is installed.
Here is how to add fractal indicators to the chart:
- Open the Insert menu, select “Indicators”, then click “Bill Williams” and “Fractals”
- Fractals can be added by double-clicking them in the list of all available indicators, expert advisors, and scripts that can be found in the Navigator window in the left side of the screen. Furthermore, the indicator can be drag-and-dropped onto the chart.
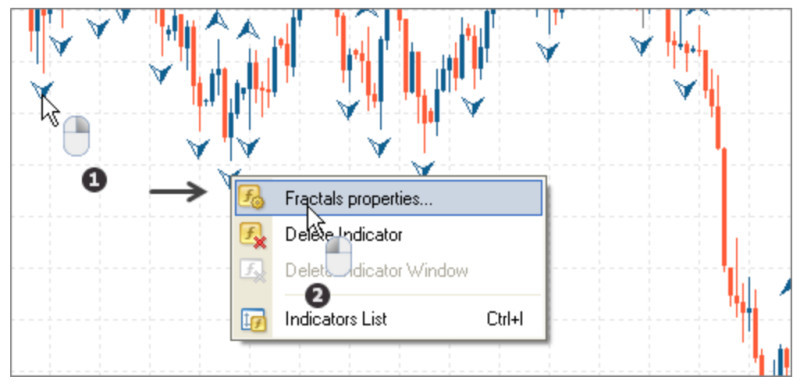
Users cannot change the calculation parameters of the Fractals indicator. However, several settings can be tweaked:
- Visual appearance - the size and color of icons can be changed.
- Period numbers - by default, the indicator is set to 5 periods, but they can be set to any odd number.
- The indicator’s markings can be set to display only on certain time frames.
Be aware that signals on higher time frames are more reliable than those on the lower time frames.
Using fractals
As mentioned earlier, a fractal trading must be formed by at least five candlesticks, with the middle candle being higher or lower than the others. In this case, the same candles can belong to several patterns at the same time.
To make it easier to discern them on the chart, the Fractals indicator marks the local peaks and troughs of each shape with arrows. The arrow is drawn either above or below a candle.
An arrow above a candle indicates a bearish fractal (fractal high), while an arrow below a candle indicates a bullish fractal (fractal low).
As with many other indicators, the reliability of the signals is highly dependent on the selected time frame. On higher time frames, the signals are more accurate than on lower time frames, even though there are fewer signals being produced.
The Fractals indicator can be used in the following situations:
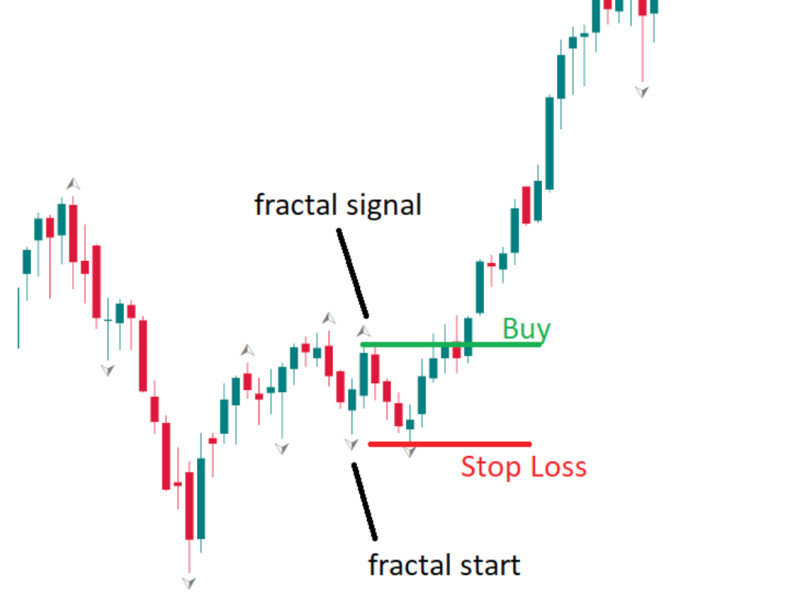
• Finding a place for Stop-Loss orders. When opening a short position, a Stop-Loss order is set at the high of the previous fractal pattern, and vice versa.
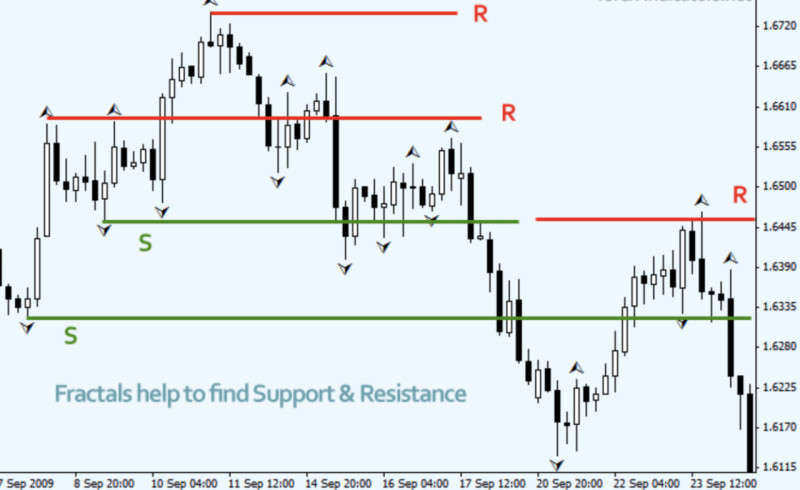
• Determining support and resistance levels. The levels highlighted by the highs and lows of the Fractals indicator are typically very strong.
• Detecting market consolidation. When the asset does not break through a fractal and a non-standard structure is formed later, it may indicate the beginning of a horizontal trend.
• Detecting market entry points. One of the easiest ways to open a position is to place pending orders above or below the level of the central candlestick, which corresponds to a strong support and resistance level.
Fractal trading
Bill Williams initially designed his trading system, including the Fractals indicator, for trading in the stock market. However, his indicators and trading techniques are now used by traders in other markets as well, including the forex market.
Experienced traders never make decisions based solely on signals from a single indicator. Trading using fractals will be more precise when fractals are used together with other tools.
These patterns cannot predict future price movements, but they clearly reflect the current situation in the market. They indicate the current direction of the asset’s movement, which traders can follow.
The simplest trading system that includes the Fractals indicators also uses two moving averages with different periods, for example, 45 and 95.
By using moving averages, a trader can determine the dominant trend in the market. If the short-term MA is above the long-term MA, it indicates bulls are dominant. When the slow MA is above the fast MA, it indicates that bears are in control of the market.
Afterwards, a traders needs to look for buy and sell signals. These signals are usually generated when two moving averages intersect.
Then, the trader should wait for the first bullish fractal to emerge. New long positions can be opened after the asset breaks above it. Accordingly, short positions can be opened after the asset forms a bearish fractal and breaks below it.
This trading system is suitable for assets with highs price fluctuations. When the asset is moving within a tight range, neither moving averages nor fractals provide good results.
Fractals and Alligator indicators
As mentioned earlier, using only the fractals indicator cannot be considered a reliable trading strategy. Additional instruments are necessary to confirm and filter its signals.
Typically, fractals are used alongside other indicators. For example, they are often combined with another indicator by Bill Williams, the Alligator.
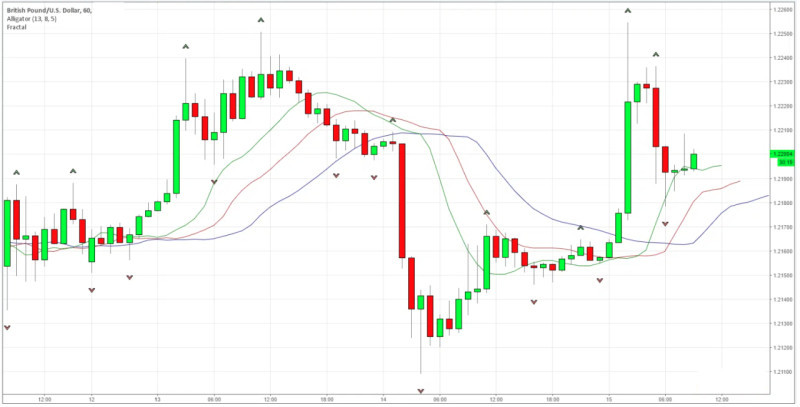
The Alligator indicator is based on three moving averages with periods of 13, 8, and 5, respectively, which are simultaneously overlaid on the chart. When the lines intertwine, it indicates a period of consolidation in the market (the Alligator is "sleeping").
When the lines are stretched apart and the distance between them increases (the Alligator's "jaws" open), it indicates a strong trend in the market.
The best time frame for using fractals and the Alligator indicator is H4. After the end of a sideways movement period, the asset breaks through the boundary of the price range.
The direction of the breakout provides a clue about the asset’s trajectory and whether long or short positions should be opened. If the asset is below the Alligator's middle moving average ("teeth"), short positions are opened, and vice versa.
After this surge, the asset performs a slight pullback during which a fractal pattern is formed. The entry point into a position is determined by the moment the asset breaks through the fractal’s highs or lows.
A Stop-Loss order is placed above the Alligator's "jaws" to prevent minor price movements from negatively affecting the open position. Profit can be taken when the Alligator's "jaws" close and the market enters a horizontal trend.
Applying this trading strategy requires a lot of experience and practice. We recommend practicing on a demo account before using this tactic on a real account.
Fractals and chart patterns
Many traders use not only technical indicators but also other methods of market analysis, such as candlestick patterns.
Some of these patterns confirm the continuation of the current trend, while others indicate an upcoming reversal.
However, these patterns are often subjective. Each trader sees the chart in their own way based on their knowledge and experience.
Some traders see chart patterns where there are none or fail to notice the patterns that actually form on the chart. Additionally, two different people may see two different patterns, as many of them resemble each other.
Combining chart patterns and fractal indicators can yield good results when used carefully.
For example, fractals can show several common patterns when applied to the well-known Head and Shoulders candlestick pattern.
When both "shoulders" emerge on the chart, corresponding fractals are also created, which can be used to identify significant support and resistance levels.
The neckline of the pattern is also confirmed by the formation of multiple fractals lows, indicating an upcoming upwards reversal.
A breakout of the neckline by the price chart confirms that the pattern has been fully formed. Short positions can be opened once the trend changes from bullish to bearish.
Advantages and disadvantages of fractals
Like any other analytical tool, fractals have their advantages and disadvantages:
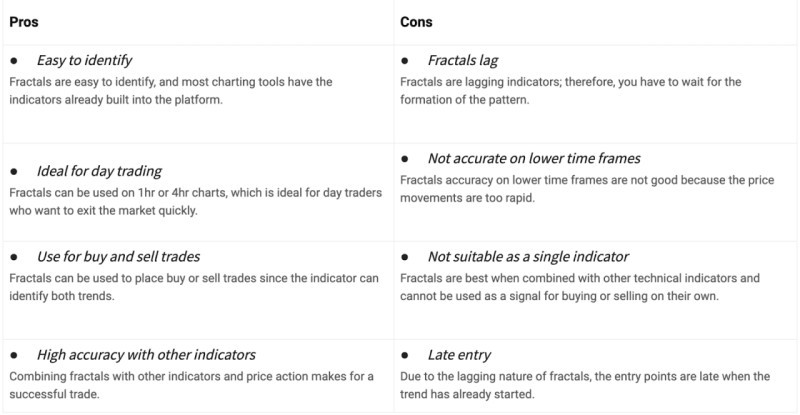
- Fractal patterns can be used as reference points for Stop-Loss orders, as well as identifying support and resistance lines, highs, and lows on the chart.
- These patterns can help accurately determine waves on the chart and find the safest market entry points.
- Breakouts of the fractal patterns often confirm the direction of the current trend.
- The indicator can be applied to any assets and on any timeframes. However, it is important to note that more reliable patterns are formed on longer time frames.
Here are the main disadvantages of fractals:
- The indicator cannot predict price movements and can only help determine the market situation at present.
- The indicator is laggy. After the pattern forms a high or low, two more candles are required to fully confirm it.
- If there is no clearly defined trend on the chart, the indicator can create false signals.
- Fractal indicators are unsuitable for novice traders. Beginners might find the use of fractals difficult and very confusing.
- Very often, false patterns are formed on the chart. To determine which pattern is actually a fractal, traders mustunderstand the fundamental rules of the pattern’s formation.
Rules for using fractals in trading
To successfully apply the fractal indicator in your trading strategy, it is important to observe certain rules:
- Pay attention to the structure of the pattern itself. A typical fractal consists of five candlesticks, with the middle one being a local high or low.
- Minor deviations from the classic form are also allowed. For example, there may be more than five candles; however, the number of candlesticks should preferabbly be odd. Additionally, if there are two peaks or two bottoms with the same values on the chart, the second one is not taken into account.
- Select the appropriate time frame. Generally, patterns formed on higher timeframes are considered more reliable than those formed on lower intervals.
- To filter or confirm fractal signals, use additional tools. For example, fractals can be applied together with the Alligator indicator, as used by the creator of the fractal indicator, Bill Williams.
- Fractals can also be used to confirm chart patterns. Afterwards, traders can select an entry point into a position.
- It is possible to plot fairly strong support and resistance lines on the chart based on the pattern in question.
- Keep in mind that fractals tend to lag. Moreover, the greater the number of candles the pattern has, the greater the lag. A fractal consisting of five candlesticks has a lag of two candles.
- Learn to distinguish true fractals from false ones. Some ways of doing so were listed earlier.
Conclusion
In this article, we have examined the fractal indicator and its use in trading. This tool is quite notable but challenging to use.
Firstly, fractal patterns have numerous variations which can confuse traders, especially beginners.
Secondly, the named of the pattern can cause some confusion: "fractal low" indicates the beginning of an uptrend, while "fractal highs" signifies a downtrend.
Thirdly, false patterns can be formed on the chart. Traders should be able to distinguish between the two.
Moreover, fractal trading indicators alone cannot provide precise signals due to several reasons, one of which is lagging.
Experienced traders combine fractals with other tools. This indicator synergises well with the Alligator indicator. Using both of these tools simultaneously can yield great results/
Furthermore, fractals can be combined with chart patterns.
You may also like:
Standard deviation trading strategy


