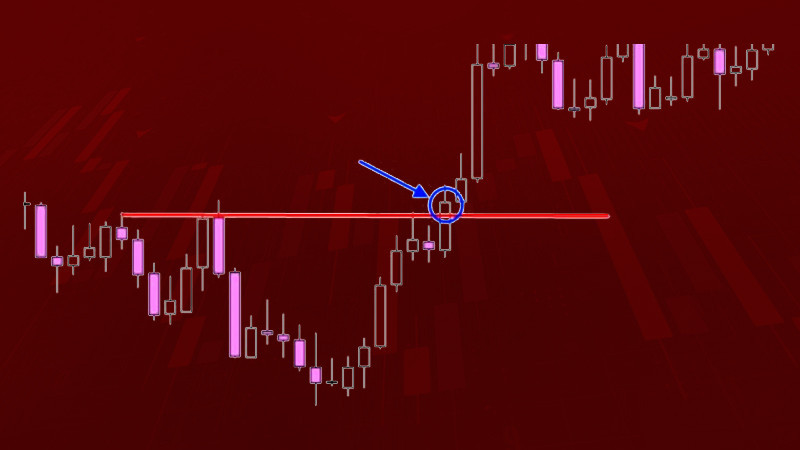
Support and resistance, correctly superimposed on the chart, are quite strong boundaries that are quite difficult to break through. The price can repeatedly touch these levels, but not cross them. The moment of breakout does come for some time. However, a rather strong impulse is required. This article explains how it happens and what consequences it leads to.
If you want to learn more about levels themselves, how they are formed, and how you can trade using them, we recommend reading the article "Trading levels".
Understanding level breakdown
So, what is a level breakdown and how does it occur - let's try to understand it in this and the following sections. A level breakout occurs when the price pierces one of the boundaries - support or resistance - and settles above or below that level.
In other words, the price rises above resistance or falls below support. This is often preceded by a prolonged hovering of these "boundaries".
An important element of the breakout is the fixation of the value chart above the resistance line in the case of an upward breakout, or below the support line in the case of a downward breakout.
Fixation means that the price is above or below the level for a relatively long period. This indicates that the breakout is real.
There is another important change that occurs on the chart at this moment. When the price crosses the resistance, it automatically becomes a new support. And vice versa, when the lower border is broken, it becomes a new resistance.
Notably, the stronger the level was, the more important its role becomes when the chart breaks through it. That is, if a strong level is broken, we can expect a rather strong impulse and a long price movement in the direction of the break.
False breakout
In order to successfully trade using support and resistance levels, it is necessary to be able to distinguish a false breakout from a true one. Let's try to understand what a false breakdown is and how to find it on the chart in this section.
So, a false breakout is a situation when the price tries to break through one of the boundaries and even crosses it. However, the price impulse is not strong enough, and the price returns to the previous boundaries.
False breakouts occur all the time and are the result of crowd behavior. It happens when buy trades are opened en masse at the peak of price movement or sell trades are opened at the very bottom.
To a greater extent, this is typical of novice traders who enter a trade just before the reversal. It seems that they open positions at the safest moment, but this is not the case.
What are the types of false breakouts? Let's analyze the most important ones:
1. Bull or bear trap - this is one of the classic bullish or bearish false breakouts of major boundaries.
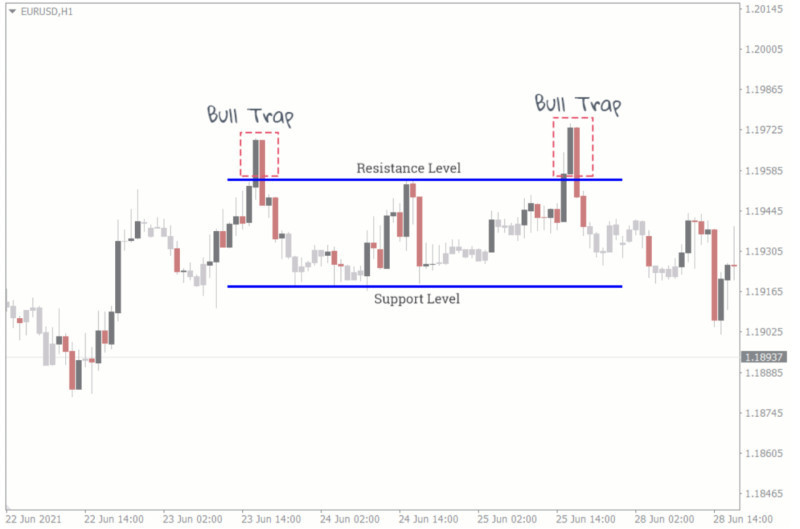
This pattern appears on the chart after a powerful directional movement when the price approaches the main level. Traders are often confused by the rapid approach of the price to one of the boundaries, but the breakout turns out to be false.
2. A consolidation breakout can occur when the price moves within a certain channel for a rather long period of time. Traders may think that it is already time to go outside the boundaries, but the price returns inside the range again.
3. A false breakout of the inner/outer bar. This situation is possible when there is a breakout by one candlestick, but the subsequent candlesticks close inside this bar or its range.
A false breakout can be a harbinger of a sudden change in the price movement or a change in the dominant trend. Therefore, it is important to be able to find them and use them for your benefit.
How to identify false breakout
We have already found out what a false breakout is and what its types are. Now it is important to understand what the main differences between true and false breakout are. Let's try to understand this and make some algorithm of actions to check.
There are two key features that indicate that the breakout is actually false:
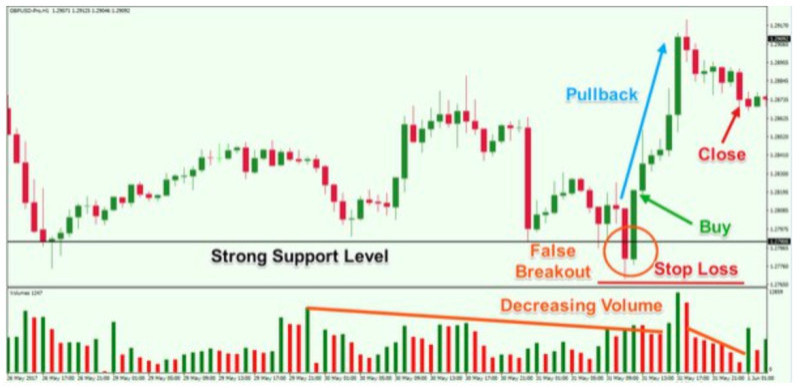
1. Minimal volumes at the moment of breakout - this indicates that the breakout is not confirmed by volume indicators;
2. A large number of bids and orders in the direction of returning inside the range boundaries.
Another important thing to pay attention to is the look of the chart itself. If the chart looks "jagged" and shows low volatility, the chances of opening successful trades will be quite low.
False breakouts are created to attract inexperienced traders who open positions in the wrong direction. In this case, such a false price movement is like a springboard for a powerful breakout and making a true breakout in the opposite direction.
When traders believe that a level breakdown may occur, they begin to actively open positions. At the same time, most of them also use protective orders in case the breakout turns out to be false and the price goes back inside the boundaries.
When the price tries to break through one of the boundaries but comes back, stop-loss orders are triggered. On top of that, other traders start to open new positions, which has a significant impact on the price.
In the end, the price not only reverses to the opposite side of the breakout but can start moving quite strongly in that direction.
Why breakouts occur
Why do breakouts occur? Are there any reasons for this? Let's try to understand this in this section.
It is necessary to understand that the crossing of one of the levels by the price is not a random event. Most traders believe that the breakout is the result of some actions of professional traders.
Often, before the breakdown occurs, professional traders accumulate their positions, which leads to the fact that a rather narrow range is formed on the chart. After moving in such a narrow corridor, the cost rushes beyond its limits.
However, the actions of retail traders can also influence the occurrence of a potential breakout. Thus, a breakout is caused by placing a large number of orders in the direction of continuation of the current trend.
Even a small movement of the price in the opposite direction will trigger traders' protective orders. This will give the price another additional impulse.
As mentioned earlier, more and more traders start opening positions according to the trend. They do this in order to catch the wave of the new price movement at its very beginning.
All these factors contribute to the fact that the price does break through one of the levels and continues to move in the direction of the breakout.
However, not always the dominance of buyers means that the price will move up, and the dominance of sellers - that it will decline. Usually, these are Inexperienced traders, who actively open buy or sell transactions in the hope that the price will continue to rise or fall, moving the market.
This is how false breakouts occur, as they are not supported by any real events occurring in the market. Since neither beginners' bets nor triggered protective orders can steadily move the price in one or another direction.
How to trade using breakouts
Breakout trading strategies are quite common among traders, including beginners. The main idea of such an algorithm is to get the maximum benefit from a powerful price impulse, which is required to make a breakout.
And indeed sooner or later the breakout of one of their levels does happen. Although this may be preceded by a certain number of false breakouts, which can bring the trader considerable losses if you react to each of them.
There are two main ways to trade on the breakout: aggressive and conservative. They differ in the moment of entry and the level of risk, but also in the potential profit that can be made.
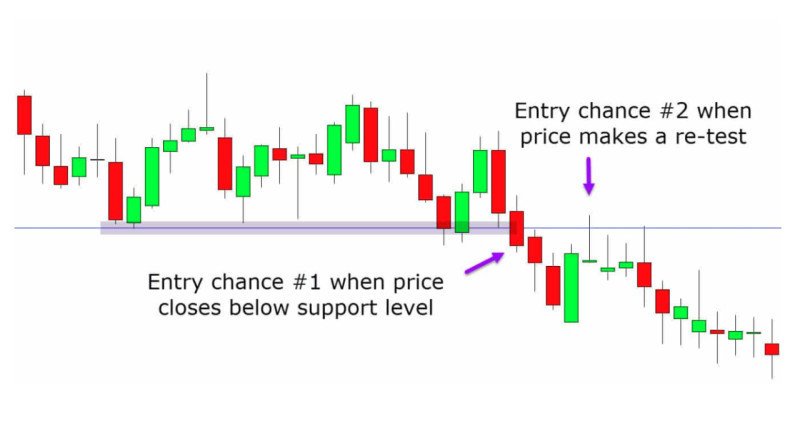
An aggressive strategy assumes that positions are opened immediately at the moment of breakout. This tactic is the most risky, as the breakout may turn out to be false. At the same time, the potential profit is maximized, as the entry is made at the very beginning of the movement.
A conservative strategy implies opening positions not immediately after the breakout, but after the price returns to the broken level and, bouncing from it, starts to move towards the breakout again.
This tactic also has its own risks. First, you may miss the opportunity to open a position, as the price may not return to the level, but immediately start to move toward the breakout level.
Second, a trader loses time waiting for the price to return to the broken level. Accordingly, the size of the potential profit is lower, as the maximum impulse occurs exactly at the moment of breakout.
In order to protect their positions, traders often use protective orders. There are also several variants of their different application.
Some users set take-profit orders, i.e. a profit limiter. Such an order is set slightly above the point of position opening (in case of an upward breakout) and allows to guarantee a small but stable profit.
There is another possibility - it is a limitation of losses by setting a stop-loss order. Often a floating order is used, which moves with the movement of the price. Such an order will be relevant if the price moves without pullbacks.
Channel trading
In addition to breakout trading, support and resistance trading offers other possibilities. Often, traders, who use short-term algorithms, also use trading inside the channel.
Support and resistance levels, which are already well known to us, are used to build a channel. The distance between them depends on the market situation. When there is a clear trend in the market, the boundaries are far enough from each other, when there is a flat market, they are located closer.
Trading channels can be not only horizontal but also inclined. Another way to draw the boundaries is with the help of indicators: moving averages, Keltner Channel, Bollinger Bands, and others.
If the channel’s boundaries are drawn correctly, the price will move within its limits for a rather long period of time. At the same time, the chart can touch one or the other boundary and move away from them.
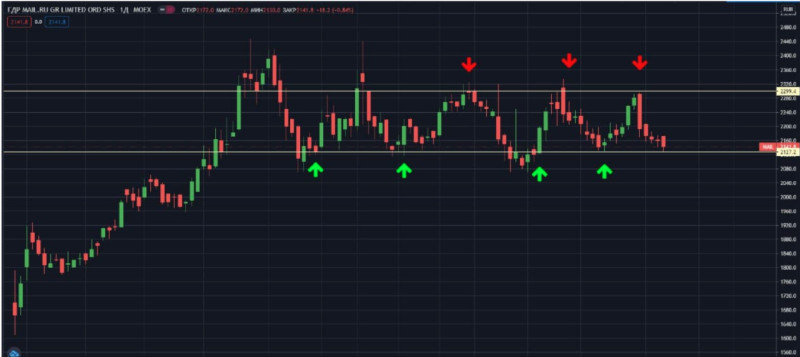
When the price moves within a narrow channel, it makes sense to open short trades when the upper boundary is touched and long trades when the lower boundary is touched. Each of such positions will bring a small but stable profit.
If there is a trend movement and the channel is built by sloping lines, you can slightly change the trading tactics. Thus, in case of an upward direction of the channel it is recommended to trade on the upside, i.e. open long positions at the lower line and close them when the upper limit is reached.
In case of downward movement and building a descending channel, it is necessary to trade on the downside, i.e. open short positions when the upper limit is touched. Positions are closed when the price touches the lower boundary of the channel.
During increased volatility in the market, the price may go outside the channel for some time. In this case, it makes sense to expand its boundaries to take into account all movements.
Channel trading - dynamic levels
When the market situation is unstable, it is convenient to use dynamic levels that move and change together with the price. For example, a channel built with the help of Bollinger Bands is one such tool.
The channel boundaries can expand when the price fluctuations become more intense, and their direction indicates the course of the trend movement. When the trend movement of the value stops and a flat occurs, the bands narrow.
The principle of trading is the same as with any other level. When the upper limit is reached, short positions are opened, and when the lower band is reached, long positions are opened.
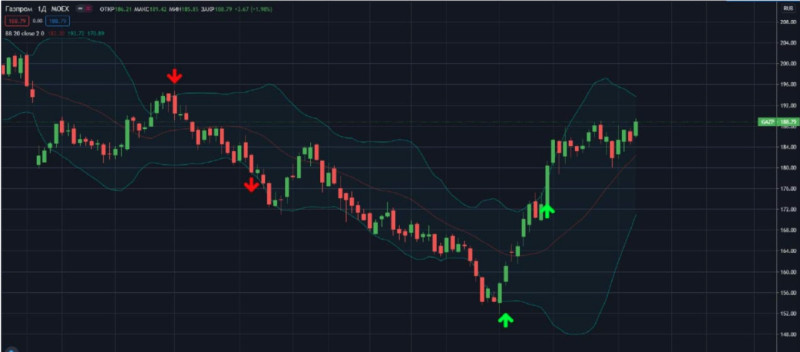
There is also a middle line, which serves as an additional reference point. When after a sideways movement, the cost breaks through the upper line, and the middle line is also directed upward, it confirms the possibility of entering a buy trade.
If after a sideways movement, the cost begins to go below the lower boundary of the bands, and the middle line is also directed downward, it is considered as a signal to enter a short position.
Another similar tool is the Keltner channels. The difference between them lies in the way of calculation and boundary construction: for the Keltner Channels indicator the ATR parameter is used, while for Bollinger Bands the standard deviation is used.
Due to the fact that the calculations are made in different ways, the instruments can give different signals. However, the interpretation of the received signals from this indicator is identical to the signals from the previous one.
Keltner channels are trend indicators, so they work better when there is a clear trend on the chart. When the price goes beyond the boundaries of these channels, it indicates that the breakout is true and the cost is ready to continue moving in the same direction.
How to predict breakout
In order to successfully trade on a breakout, you need to be sure that it is true. That is, it is necessary to have some tools that will prompt the approach of the breakout and give the opportunity to prepare for opening a position.
It is necessary to realize that there is not magic pill. It is quite difficult to find or identify a single indicator that would be able to accurately predict the occurrence of a breakout.
Nevertheless, there are some points that should be taken into account when trading:
1. Analyze trading volumes. We have already mentioned it many times: if the cost approach to one of the levels is not accompanied by an increase in volumes, it is very likely to indicate that there will be no breakout or it will be false.
The opposite is also true: when the price is approaching a resistance level and the volumes are growing, it indicates an upcoming bullish breakout. If the price is moving down to the support level and the volumes are growing, a bearish breakout is expected.
2. Analyze the asset profile. If the price has been moving within the boundaries for quite a long period of time, it is very likely that it will soon break through one of the lines.
The price, moving within a certain range, is in a state of balance. Nevertheless, after a certain period of consolidation, it needs to find a new balance, which leads to the exit from the previous "frames".
3. Concentrate at the moment of breakout. A trader at the moment of the value breakout beyond one of the levels needs to concentrate as much as possible and act quickly. Since there is no time for thinking, it is necessary to see the big picture and react to it accordingly.
4. Pay attention to traps before the breakout. Even if the trader correctly identifies the future true breakout, right before its occurrence, there may be a small movement in the opposite direction, which can lead to losses.
Forex chart patterns
We have already mentioned that a breakout on a chart is often preceded by a period of consolidation or the formation of a chart pattern. Let's take a closer look at what forms a chart must take for a breakout to be considered true.
1. Dense consolidation, i.e. a decrease in the range in which the price moves. This pattern indicates that large traders are accumulating positions. If the value is consolidating at a resistance level, it indicates increasing buyer pressure and decreasing seller strength.
2. An ascending triangle is formed when increasingly higher lows appear on the chart. This indicates buyer strength and seller weakness. As the top of the triangle is approached, the chart compresses like a spring and then rapidly breaks out of the level.
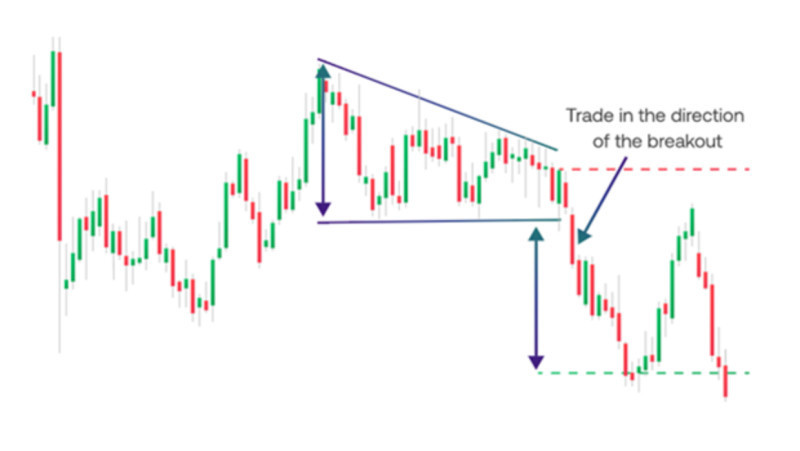
3. Descending triangle is a pattern similar to the previous one. However, its formation on the chart predicts the break of the support level and the continuation of the downward trend. This is preceded by the formation of increasingly lower highs, which indicates the weakness of buyers and the strength of sellers.
4. Head and Shoulders, Double/Triple Top - all the above patterns are formed above the support level and indicate the upcoming breakout of the value in the downward direction. At the same time, the height of this pattern is used by traders as a guide to the potential level of profit in a deal.
5. Inverted head and shoulders, double/triple bottom are patterns that are completely opposite to those described in the previous paragraph. They are formed under the resistance level and portend an upward breakout of the value chart. The height of the pattern is also used to determine the profit target.
How to identify breakout with indicators
Not all traders trust Price Action tools to determine when a level breakdownt will occur. There is quite a large group of traders who prefer to use technical indicators for this purpose.
One such indicator is Momentum. The chart of this indicator is drawn in a separate area in the form of a curved line. The most effective way to use this tool is to search for divergences.
Divergence occurs when the line of the main chart and the Momentum line move in different directions. For example, the value chart rises, while the indicator is declining.
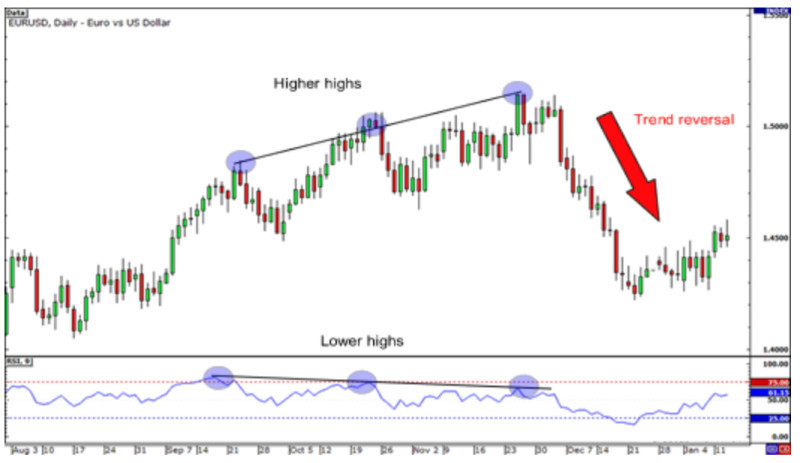
Such a divergence between the chart and indicator readings confirms a potential reversal of the value in the opposite direction. If a bearish divergence occurs, a downward breakout is expected, and if a bullish divergence occurs, an upward breakout is expected.
If Momentum shows extremely high values, it indicates the continuation of a rising trend, and if the indicator values are very low, we can expect that the declining trend will continue.
We have already mentioned volume indicators several times. It is the most simple and easy-to-use indicator for confirming and filtering breakouts on charts.
Let us remind you once again that if when the chart breaks through one of the boundaries, the trading volumes remain at a low level, it most likely indicates a false breakout.
When the price crosses one of the levels, the trading volumes increase sharply, it is a confirmation of the breakout and the possibility of opening a position on the breakout.
Cluster analysis
For a visual representation of volumes, they can be plotted not in a separate window, but integrated into the price chart itself. This is called cluster analysis.
Each cluster represents the price of the asset in a certain specified period of time, for which transactions were made. The total volume of short and long trades is reflected inside the cluster.
Each candlestick on the chart is represented as a set of clusters. Thus, you can see the total volumes of sell or buy transactions, as well as their balance in each individual candlestick at each price level.
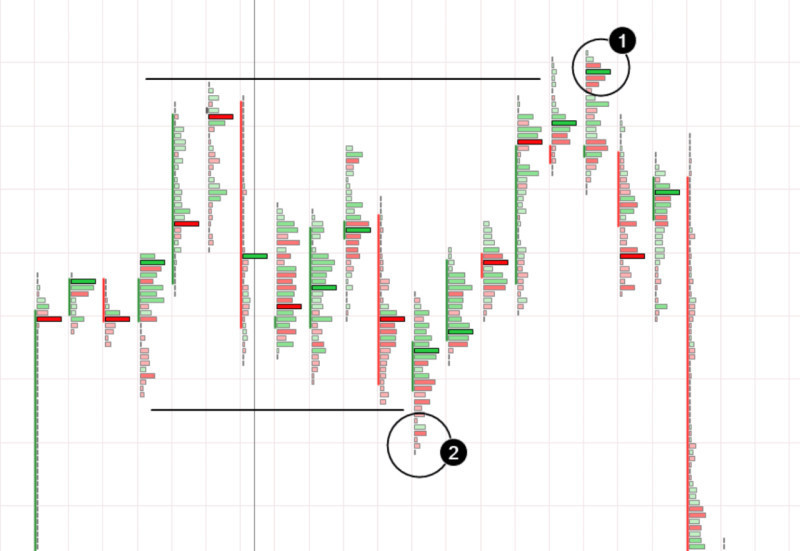
Cluster analysis makes it possible to see changes in the activity of traders even at the level of the smallest candlestick. It makes it possible to notice the exact distribution of position volumes at each of the value levels.
However, the market situation changes all the time, and the ratio of sellers and buyers changes. All these factors are primarily reflected in the volumes of transactions.
The ability to see the actions of bidders, which dominate the market at a certain moment, allows you to have an idea of the subsequent price movement. It also gives an opportunity to foresee potential breakouts.
Volumes often increase strongly during the periods of publication of the most important news and at the beginning of trading sessions. It is worth paying the closest attention at this time, because in these periods the probability of false breakouts increases, although true breakouts may occur.
In addition, you should pay attention to some other nuances. Thus, if a rising trend prevails, one should be more attentive to false bearish breakouts, and if a descending trend prevails, one should be more attentive to false bullish breakouts.
How to place protective orders
As already mentioned, it is not always possible to immediately recognize whether a level breakout is true or false. In order to protect yourself against losses, it is necessary to set protective orders.
One such order is a stop-loss order. It is set slightly above the support in case a breakout in the downward direction is expected, or slightly below the resistance if an upward breakout is expected.
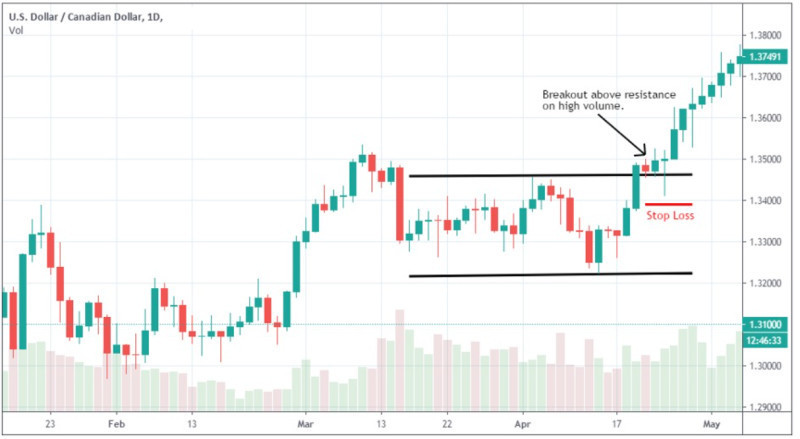
Thus, even if the price after the breakout once again returns to support or resistance to test this level, the protective order is not triggered. It will be triggered only if the price turns around after the breakout and starts moving in the opposite direction.
When a breakout position is opened and a protective order is set, you should not worry if the cost does not immediately start a directional movement toward the breakout. As long as the stop-loss is intact, your trade has every chance of success.
If the protective order is triggered, it most likely indicates that the breakout was false. That is, the cost went beyond one of the levels, but soon returned and continued to move inside the range.
Another important point that should not be forgotten when trading on a breakout is the lot size. You should not open trades with too large a volume, because in case of a false breakout, the losses will be quite large.
The reliability of the level itself, through which the price is trying to break through, is also an important aspect. The reliability of the boundary is determined by the number of times the price has tested the level before breaking through it.
The market is not driven by breakdowns or levels, they are only indicators of its current state. The main driving forces are fundamental data, which is also used by professional traders.
How to lock in profits
In the previous section, we talked about how to use and set Stop Loss to protect against losses in case the cost moves in the opposite direction.
Now let's talk about how to fix profit, i.e. how to exit trades correctly. Many traders use for this purpose the techniques of Price Action methodology, namely the occurrence of certain graphical patterns or combinations of candlesticks.
For example, when a descending or ascending triangle pattern occurs, the size of the potential profit is equal to the height of the triangle figure itself, i.e. the distance between its sides in the widest place.
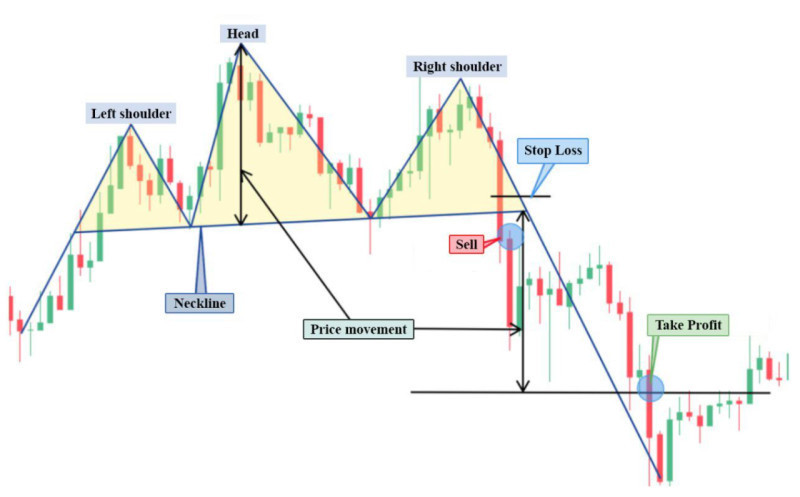
As mentioned above, the profit target is fairly easy to determine using the Head and Shoulders pattern and similar patterns. It is believed that the value movement after the breakout will be equal to the height of the pattern, i.e. the distance from the shoulders to the highest peak or the lowest trough.
However, there are other methods. For example, you can use a moving average. Its use depends on which of the levels the price breaks through.
So, if there is a downward breakout, it is necessary to keep trades open until the price is under the moving average. As soon as the cost crosses the MA and closes above it, it is necessary to close the trade.
If there is an upward breakout, the position can be kept open as long as the chart is above the moving average. At the moment the chart crosses the MA from the top to the bottom and closes below it, the position should be closed.
Pros and cons of breakout trading
Like any trading strategy, breakout trading has its positive and negative sides. It is necessary to take them into account when applying this trading algorithm.
So, the main advantages of level breakdown trading include:
- Versatility. Since this strategy belongs to price action, it can be easily adapted for any assets and any time intervals. Levels can be built on any chart, so trading on the breakdown of one of the levels will not be a problem either;
- Higher performance. Since a large number of users are oriented on the levels, the levels are really reliably worked out. Therefore, if the breakdown moment is correctly determined, it is possible to enter a profitable trade;
- Opportunities for training. The strategy under consideration gives an opportunity to learn short-term trading in practice, to make quick decisions, as well as to use protective orders competently;
- Possibility to apply other trading tactics. While the market is in a period of consolidation and it is necessary to wait until the chart breaks through one of its borders, you can trade inside the channel, opening short-term buy or sell transactions.
Among the main disadvantages of this trading algorithm are the following:
- A large number of false breakouts. There are often traps in the market that look like level breakdowns, but they are not. Beginners often fall for these tricks and end up losing money;
- Additional tools are required. Additional tools are often required to confirm the breakout, it can be indicators or patterns;
- High risks. When entering the market aggressively, positions are opened right at the moment of the breakout, which may turn out to be false. In this case, a trader may lose money, especially if he does not use stop-loss orders;
- Losing part of the profit at a later entry. If the entry is made in a more conservative way, i.e. after the chart retests the broken level, the position is opened not at the very beginning of the trend movement or the chart may not return to this level at all.
Main rules of breakout trading
Breakout trading attracts many traders with the opportunity to enter a trade at the very beginning of an active price movement and get maximum profit. But it is important to remember that there are always certain risks associated with a rebound or a false breakout.
In order to minimize risks, you should follow some rules when trading on a breakout. We have tried to put them together in this section and we recommend that you familiarize yourself with them.
1. Trade only in the direction of the dominant trend. If there is a steady upward movement of the price, it indicates the possibility of opening positions to buy. If, on the contrary, there is a downtrend, trades are opened for sale.
2. Look for confirmation of a breakout. We have already mentioned that there are a number of patterns that foreshadow a breakout of the price through one of the levels. For example, an ascending triangle predicts an upward breakout and a descending triangle predicts a downward breakout.
3. Avoid areas of bullish or bearish pressure. It is necessary to open trades in those points where the price moves freely in the desired direction. Pressure areas mean such places where the cost can make a reversal in the opposite direction.
4. Learn to choose the moment of position opening. Determining when to open a position is an important element of success in breakout trading. You can enter a trade immediately at the moment of breakout, or you can wait for the chart to return to the broken level.
5. Develop an algorithm for exiting trades. This point should be divided into two subparagraphs:
• Exit from a losing trade, i.e. the situation when the chart moves in the opposite direction. This is done by placing a stop-loss order slightly below or above the broken level.
• Closing a profitable trade. If the market moves in the right direction, you can use a take-profit or trailing stop orders, which move together with the price.
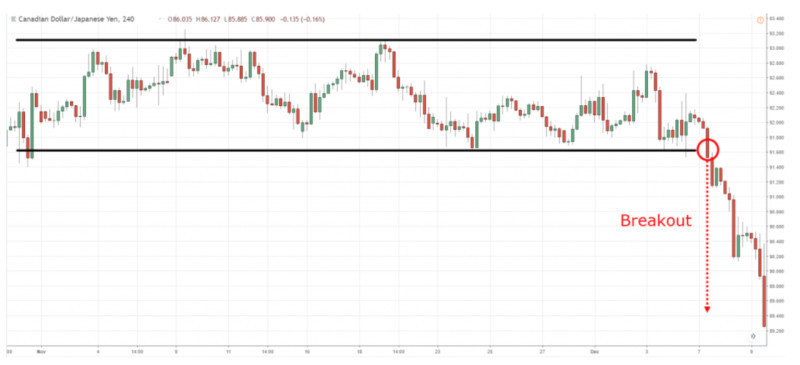
6. Pay attention to the duration of the price inside the range. The longer the consolidation period, the more powerful the breakout can be.
Conclusion
In this article, we have considered the key features of such a concept as a level breakdown, trading opportunities using it, and the advantages and disadvantages of this strategy.
A true breakout is a situation when the chart breaks through one of the levels and stays above or below it for a long time. Under such circumstances, it is recommended to enter a position in the direction of the breakout.
However, it is not uncommon that the price chart manages to go beyond one of the boundaries only for a very short period of time, and then the price returns to the previous limits. Such situations are called false breakouts.
Many users have difficulties understanding whether the breakout is false or true. But additional tools can help: one of the most frequently used tools is volume indicators.
When volumes also increase sharply at the moment of a breakout, this is evidence in favor of a true breakout. If a breakout occurs, but volumes remain minimal, it is very likely to be a false breakout.
However, there are other ways to determine if a value breakout is true. You can use chart patterns, cluster analysis, and other tools.
In addition to trading on the breakout, in periods when the price moves within a certain channel, limited by support and resistance lines, you can bounce inward from the channel boundaries.
When trading on the breakout, it is very important not to neglect protective orders. Stop-loss orders are set to protect against losses, and take-profit orders are set to lock in profits.
You may also like:


 Back to articles

