Trading, like any process in the modern world, implies constant change. It improves, modernizes, updates, and changes its forms.
However, even in this endlessly ongoing stream of changes, trading retains some basic, authentic, and important things.
One of them is Pivot Points (PP).
You can learn more about other ways of drawing levels in the article "Trading levels".
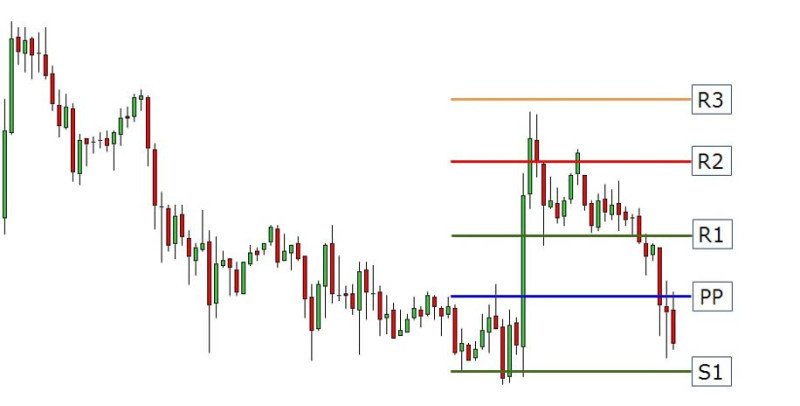
Notably, the term is used in the plural form. The point is that in trading we consider not one pivot level, but several: the central one and at least three additional ones.
Now we should say some words about the history of the concept. It came to the world of financial markets from classical mechanics. In this field, the term denotes a point around which a part of a mechanism or the whole structure turns. Drawing analogies with trading, traders found this term ideally suited to a certain situation on the market and coined it from mechanics. It happened back in the 1930s. Famous scientist, mathematician, and trader Henry Chase developed an ingenious technique of "reference points".
Over time, the term caught on so well that until today traders from all over the world use the combination named by him to build their own trading systems and identify important areas of support and resistance.
By the way, the use of pivot points in trading is not limited exclusively to individual players of financial markets. The system of calculations based on pivots has been used by major international banks and funds for more than half a century.
We will explain how to do it correctly, what calculation algorithms to use, and most importantly, how to earn profits with the help of pivot points right now.
Understanding pivot points
In order to understand the definition of pivot points, it is necessary to first study the concept of support and resistance levels. So, support and resistance levels are horizontal lines drawn through price lows and highs. This is one of the basic concepts of the currency market.
Hence, pivot points are the central and adjacent support or resistance levels, when reached, the price trajectory can change.
In other words, pivot points are potential resistance and support points that are calculated based on the previous candlestick's performance on the chart. These values include the candlestick's high, low, and closing price.
The key premise for pivot points was the assumption that the price movement is highly dependent on yesterday's price behavior.
When traders just started to use pivot points, they built them at the prices of the previous day to predict the price movement in the current day. However, today's market players have gone further than their predecessors and can build pivot points on any time frame*.
We all know that professional traders like to use strategies based on support and resistance levels. At the same time, they often face difficulties related to the exact definition of such points.
Add to this the subjectivity of decisions, personal characteristics of market participants, habitual trading tactics and the result is a lot of failed trades.
However, pivot points can be called the golden exception to this rule. Due to the fact that this system is based on precise mathematical calculations, it can be confidently called objective.
Besides, from the point of view of market psychology, the pivot points strategy does not factor in emotions, which means that it excludes the danger of traders making mistakes under the influence of emotions. This fact significantly increases the probability of profitable trades.
* Timeframe is a time interval, which is used for grouping quotes in the process of building elements of the price chart of a trading asset.
Pivot points types
Since pivot points are ingrained in modern trading, there are a great number of their varieties, which differ from each other in formulas and indicators. Thus, among the methods of calculating key levels, the following are distinguished:
• Traditional. This is a method of calculating pivot points, which is used by traders since the emergence of the concept of pivot points in financial markets.
According to the traditional method, the pivot here is the sum of the lows and highs of the previous trading session. The value obtained as a result of this calculation should be divided by three.
Based on the pivot price, traders determine where the support and resistance levels will be located.
• Classic. This trading strategy is almost similar to the traditional one, but its formula contains several important distinguishing elements.
• Woody. This algorithm is based on the closing levels of the previous trading day.
• Fibonacci. This method allows you to determine the ideal moment to enter the trend to earn maximum profit. Fibo indicates potential pivot points where the uptrend correction will change to an upward trend.
• DeMark. This strategy is a search for points that the price is able to reach within a certain period of time.
Pivot points depend on whether the previous candlestick was bearish or bullish. To determine the support level, the pivot price should be divided by two. Later, it is necessary to subtract the low of the candlestick from the obtained value.
To determine the resistance area it is necessary to add the value of the candlestick’s high to the value divided by two pivots.
- Camarilla. This is an algorithm consisting of eight levels that serve not only as resistance and support points, but also as areas for setting protective stop-losses.
How to apply pivot points in trading
Despite the fact that the strategy of pivot points trading is very similar to classic trading with support and resistance, experts distinguish a separate algorithm of trading with pivot points. It looks as follows:
• Pivots are applied to a time frame. Then traders mark the calculated support and resistance levels manually or with the help of pivot points* indicators
Most often, pivot point indicators are not included in trading platforms, but many of them are available on different websites.
Moreover, many professional traders create such indicators themselves, as they are quite simple. In order to create one, traders only need to have basic knowledge of the programming language of the chosen trading platform.
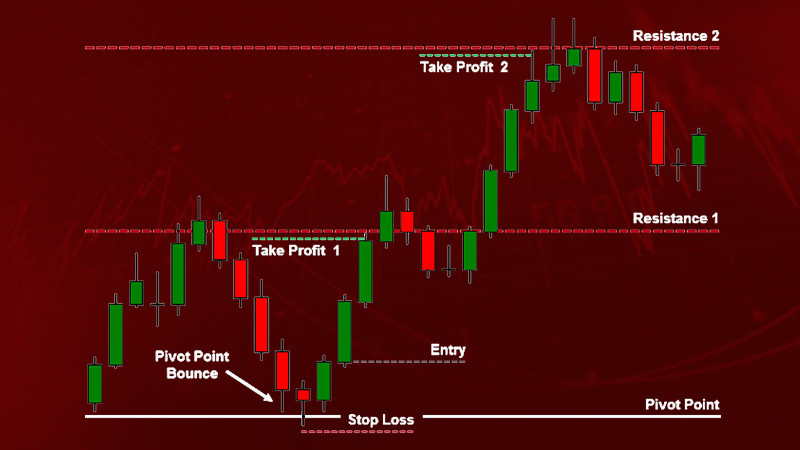
• After waiting for the breakout of the nearest level (for example, the resistance area R1), you open a trade in the direction in which the price is moving, with targets on the following areas (for example, on the resistance areas R1 and R2).
• Then, at the broken level or at the next level in the opposite direction of the price, you place a stop-loss order* to limit losses (for example, a stop-loss order can be set below the broken R1).
In addition, the basis for the pivot points strategy can be placing limit orders on a rebound from a level when the trader expects a breakout and further retest*.
Notably, pivot point trading differs significantly depending on the markets. Thus, if a trader chooses pivot points in order to earn on Forex, he or she should remember that the market operates around the clock.
This means that the closing prices and extrema should be tracked according to the time of the US trading session or use the terminal time. As a rule, market players forget about it when trading. To avoid such a mistake, you can use automatically calculated pivot values.
Importantly, the level of volatility in the currency markets is very different from the level of price volatility in the securities markets and can change dramatically due to the release of important news. Therefore, traders need to constantly monitor the events in the economic calendar and realize that the situation in the market can change dramatically when fresh macro statistics appear.
Having considered the detailed algorithm of trading on pivot points, we come back to the fact that this strategy is very similar to trading on classic support and resistance levels. Therefore, the main rule in pivot points strategy is to always pay attention to how the price moves near these levels.
After you have decided on the strategy, many people may think that the rules of trading using pivot points are extremely simple. However, this is not quite true.
The fact is that trading in financial markets involves a lot of unplanned situations and unpleasant surprises, because of which pivot points do not work every time. Often the price of an asset fluctuates near key points, and sometimes it is quite difficult to predict in which direction it will move in the near future.
Sometimes the price can reverse before reaching one of the pivot points, failing to cover a couple of pips to the target.
It can also happen that a market player is sure that the chosen pivot is a strong enough support level, and they open a long position. However, the price may unexpectedly turn around and rush sharply down toward the set stop-loss order.
Features of trading with pivot points
Professional market players determine a trend based on the location of the opening price of the current trading period in relation to the pivot area:
• Thus, if the trading session opens above pivot points, first of all, it is better to buy the asset
• If the trading period opens below pivot points, it is best to open short trades
• If the first support or the first resistance is not broken, as well as in case of a false breakout*, the price is highly likely to move in the range between R1 and S1
• When levels are broken or tested, it is important to use filters as well as confirmation signals.

* Indicators are tools used to analyze and make forecasts of price changes in financial markets. In other words, they are based on the volume of a certain trading instrument and its prices.
* Stop-loss order is a type of protective order that a trader places to automatically close a trade. A stop-loss order helps to limit possible losses.
* Retest is a trading phenomenon when the price of an asset retests a key support or resistance area several times. That is, when breaking through a trend line, the price returns below or above this line again.
* False breakout is the phenomenon of the price going beyond the key level, which creates the effect of its breakout. In this case, a false breakdown is necessarily accompanied by the return of quotes to the price range, as a result of which they move in the direction opposite to the breakout.
Advantages of pivot points strategy
The key advantage of pivot points is undoubtedly their permanence and immutability. For example, the use of technical indicators requires periodic optimization, while pivot points have been used in their original form for ninety years.
Despite such a long period of time of using the strategy in trading, its efficiency is still very high. That is why pivot points continue to be used by traders, analysts, and investors all over the world.
No less important advantage of pivot points is that they have objectivity, as their principle of operation is based on precise mathematical calculations. By the way, pivots are similar to Fibonacci* levels in many of their characteristics. For example, traders quite often use them as a self-executing signal.
However, there is one significant difference between Fibonacci lines and pivot levels. Thus, using the former, a trader has to determine the maximum and minimum points of price fluctuations by himself.
Because of this, the use of Fibonacci lines threatens subjectivity. In the pivot points method emotions are excluded.
Another value of pivots lies in their convenience and usefulness for market players who are interested in short-term trading. Most often, short-term traders use classic support and resistance levels, trading on their rebound and breakouts. However, the pivot point strategy works more effectively in this case.
For example, channel traders who trade using resistance and support apply pivot points where their buy and sell orders will be placed.
Meanwhile, players who are forecasting a sharp change in the price of an asset view pivot points as key areas that should be broken in order for the asset's movement to continue. Thus, a breakout of these points will signal a strong move.
Another advantage of pivot points can also be called the possibility of using them on any time frame. However, traders calculate pivot levels, as well as additional reversal points for new prices of a trading session or day, using the prices of the previous day.
Notably, the pivot points method shows maximum efficiency on time frames higher than one day. Thus, investors who prefer long-term trading can safely apply the pivot points using the prices of the previous week or even month.
By the way, the strongest pivot points coincide on different time frames. For example, if pivot points on a daily chart coincide with ones on a weekly time frame, these points are considered potentially stronger.

The pivot points method allows traders to study the sentiment prevailing in the market quite accurately. What does it mean? Knowing the current situation in the market, an investor can accurately determine whether the market participants are more inclined to buy or sell. Thanks to this, traders can plan further steps to conclude a profitable trade.
For example, if the price of an asset breaks through the central pivot point upwards, it means that the market situation is dominated by buyers, so there is a high probability of a price increase in the future. In this case, it would be reasonable to think about buying an asset.
At the same time, the market situation is constantly changing: traders' sentiments may change dramatically, and today's trading session may be completely different from yesterday's. Therefore, you should not buy an asset when its price is above the central level, and you should not sell an asset when its price has collapsed below the central level.
Pivot points are a completely undemanding and non-conflicting trading strategy. It works perfectly solo and paired with all kinds of indicators. Besides, if you combine pivot points with other indicators, you will be able to determine the market situation quite accurately and enter a trade more successfully.
As a rule, the pivot point method works best in highly liquid markets*, of which Forex is undoubtedly the most popular among traders. However, the strategy turned out to be so unique, undemanding, and easy to use that it has proven itself in many other markets as well.
Thus, traders use pivot points when trading cryptocurrencies, precious metals, futures, securities, commodities, etc. For many players in the global markets, pivot points have become an ideal tool to increase trading profitability.
Despite the many advantages of using the pivot point method listed above, it is important to realize that the strategy is not magic.
Pivot levels are a predictive tool, which means that their use does not guarantee a 100% positive result in every market situation. Like any other technical indicator, pivot points can sometimes let a trader down on the way to achieving profitable results.

* Fibonacci levels are the basic graphical levels of support and resistance. With the help of these values of correction and expansion traders can analyze any asset and predict the future price movement.
* Highly liquid markets are markets that record regular purchase and sale transactions of assets that are traditionally traded in these markets.
Conclusion
Pivot levels are an ideal market tool that helps traders find the most profitable entry points and develop an intraday trading strategy in advance.
Using pivot points, traders get a visual map of the market and the opportunity to calculate the price position in relation to the position on the previous time frame.
Thanks to this possibility, the market player's trading efficiency increases significantly. With the help of pivot points, traders can easily determine the market sentiment and make forecasts regarding its further movement.
At the same time, the maximum benefit of opening pivot points will be that traders are able to determine the most suitable trading strategy.
In addition, the pivot points method is quite simple and does not require a lot of time and effort. Modern technologies and tools for trading are well-developed. Thanks to the capabilities of any trading platform, traders can calculate the location of the pivot points in a couple of seconds by applying one of the special indicators.
In this case, the use of a pivot point strategy paired with such technical methods as moving averages or Fibonacci levels gives a truly impressive result.
Surprisingly, some traders still disregard pivot points or do not even know about this useful trading tool. However, trading with pivot points is based on the most simple and intuitive rules, which even a novice trader can easily understand.
Of course, professional traders have developed their own approach to trading. Some make transactions relying solely on intuition, and some follow old-timers of the market, who have written many books about trading.
However, there are those who clearly understand that trading in financial markets is primarily mathematics, numerical regularities, and a set of rules regarding price behavior. It is for such market players that trading with the help of pivot levels will be the ideal first step on the way to making profitable trades.
You may also like:


 Back to articles

