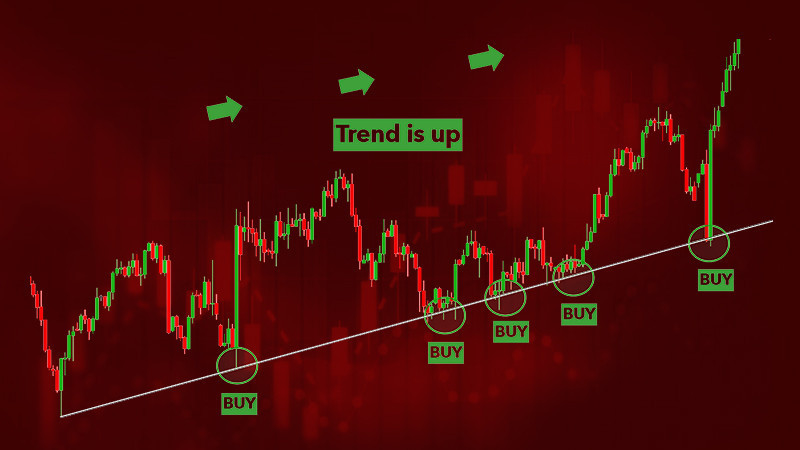
Perhaps, every trader has heard about levels and trading levels using them. Some traders prefer channels, while others tend to trade on breakouts. At the same time, everyone should know what levels are and how to use them. It may seem that there is nothing complicated in identifying support and resistance. However, it causes difficulties for some users, especially beginners.
We will talk about how to determine support and resistance, their application in trading, as well as their pros and cons in this article.
Understanding levels in trading
The movement of the value of any asset may seem chaotic only at first. In fact, it has certain patterns, thanks to which it is possible to build trading strategies and get profit from trading.
Price movement is influenced by a number of factors. All of them should be taken into account when analyzing the market and before opening a position to buy or sell an asset.
Levels are an important element of any chart, and their correct building is one of the key skills of a trader. We will talk about what levels are and how to accurately draw them on the chart in this and the next sections.
Support and resistance are horizontal lines that are drawn on the chart by swing lows and highs. In this case, support is located at the bottom and is drawn through the lows, and resistance is located above and is drawn through the highs.
The essence of these levels is that they are a "limiter" that the price cannot overcome until a certain point. In the case of the upper limit, the price does not go higher, and with the lower limit, it does not go lower.
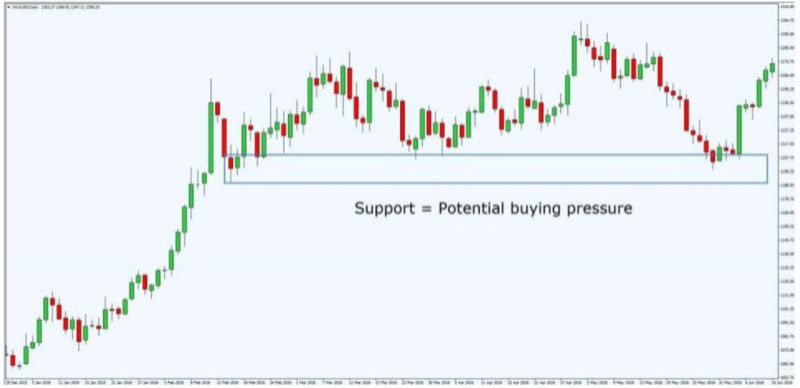
The support level is based on the lowest values. This means that the price is too low and fewer sellers want to sell at this price, but more and more buyers would like to buy the asset.
The resistance level, on the contrary, is built at the highest price values. This means that the price is at too high a level and fewer buyers want to enter into buy transactions. At the same time, a large number of sellers are willing to sell.
Types of levels
There are three main types of support and resistance levels:
1. Fixed or static;
2. Dynamic;
3. Semi-dynamic.
Fixed levels remain unchanged regardless of how the value of the asset moves. There are several important points to consider in order to determine such levels:
- Psychological levels;
- yearly highs and lows;
- highs and lows, as well as open and close prices.
It is important to pay attention to psychological levels and their meaning. Let us dwell on this aspect in more detail. People and their actions have the greatest influence on the movement of asset values.
It is easier for a person to operate with whole numbers. Therefore, the strongest psychological levels are those that have two, three, or four zeros at the end. The simpler the number, the stronger the level.
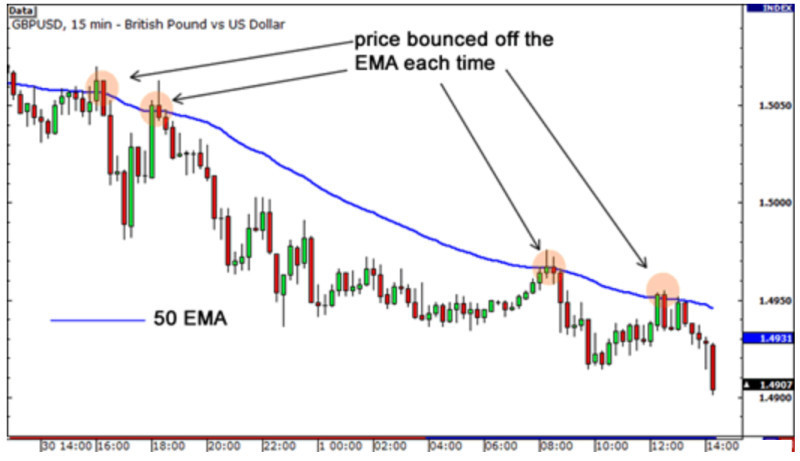
Dynamic levels change with the changes in the chart readings. These are horizontal lines, but they are smoother and repeat the contours of the chart. For example, moving averages are often used to build such levels.
Besides, dynamic levels can also be drawn with the help of other tools. The most famous are Parabolic SAR, Bollinger Bands, Keltner channel, and others.
Semi-dynamic levels look like horizontal lines. However, they do not stand in place, but move little by little following the chart until the current trend completely changes to the opposite one.
This is especially characteristic for periods of sideways movement, or flat. The chart seems to move within a certain channel with the price bouncing from its upper and lower boundaries.
How to build levels on chart
It should be understood that levels are areas rather than lines. Therefore, there is no need to try to determine support and resistance strictly by the bodies or shadows of candlesticks on the chart.
In some cases, it is possible to combine several lines that are close to each other into one support or resistance zone. This way, more candlesticks will fall into it, so it will be a more reliable reading.
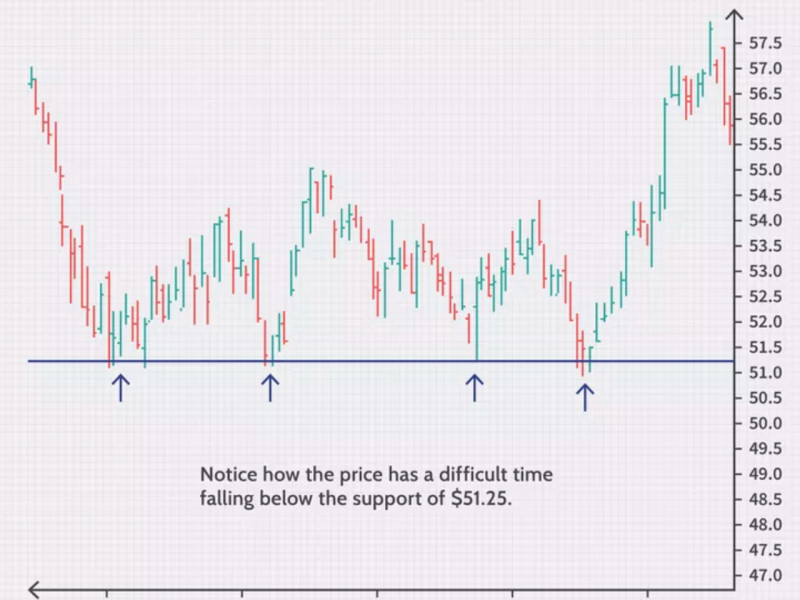
What is really important is to draw the level in such a way as to ensure that the chart touches the drawn line as many times as possible. Often this may require moving the line up and down many times.
It is also not necessary to watch all previous candlesticks. As a rule, the current chart is used to draw support and resistance.
Often the levels are drawn according to the last 100-150 candlesticks, it is quite enough. Thus, when drawing the levels, the data on the change in value for the last six months are used.
In order to apply the levels correctly, it is necessary to choose higher time frames - from D1 and above. The lower the time frame, the faster the value will be able to overcome the drawn line.
It is important to focus on those levels that are key. Such levels are quite easy to identify, as they are clearly visible. You should not try to put too many marks on the chart, as they will only cause confusion.
Pay attention to the fact that levels are placed strictly horizontally. All other marks that are drawn at an incline are called lines, not levels.
Precise determining of levels on chart
We have already talked about the need to correctly define and build support and resistance levels. However, it is not easy to do it, especially for beginners.
In order to facilitate the task, special indicators have been developed, one of them is Pivot Levels. With the help of this tool, it is possible to determine support and resistance on the chart of any trading levels asset almost without errors.
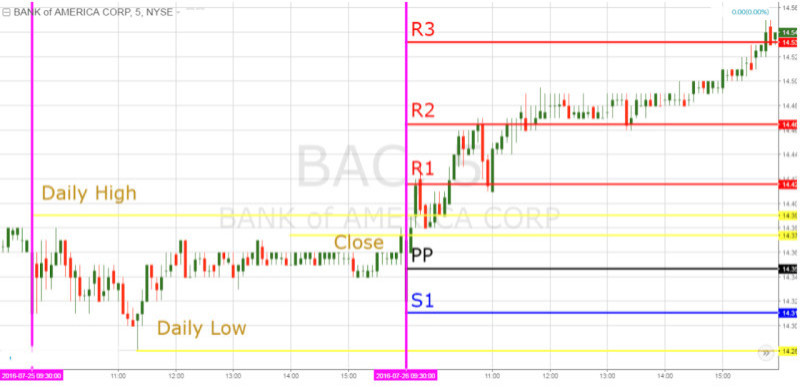
To begin with, the center line is drawn, which is the strongest and is denoted as a Pivot Point. However, in addition to it, several additional lines above and below the central line are calculated and plotted on the chart.
Pivot points, on which these lines are built, are calculated based on the previous trading period. To find the key level, calculations are made on the basis of the max, min, and close of the previous interval.
The main line is used to determine the dominating trend in the market. Thus, if the chart is above this line, it indicates the prevalence of the bullish trend, if it is below it - the bearish trend.
In addition to the above-mentioned methodology, you can determine support and resistance in other ways. For example, there are tools that allow you to analyze extrema on the chart, that is, to find the low and high.
In addition, there are indicators, which we have already mentioned earlier, that allow you to build dynamic levels. Such levels move together with the changes in the chart and repeat its curve.
Also, one of the well-known techniques is the application of Fibonacci numbers. When applying this tool, several levels are applied to the chart at once - at least four, each of which has its own value.
Trading with levels
Sloping lines are drawn during periods of directional price movement. While horizontal levels form a channel or corridor within which the chart moves during flat periods.
Depending on the state of the market, appropriate trading strategies are selected. During the presence of a clearly defined trend, trading from the levels or level breakout is possible.
Positions are opened when the chart approaches one of the lines. If the chart breaks through one of the borders, a deal is opened in the direction of value movement. In case the chart bounces from one of the edges, the position is opened in the opposite direction.
It is important to remember that no one can guarantee that the cost will continue to move in the same direction. Therefore, it is very important to place protective orders that will allow the trader to limit potential losses.
When the market is flat and its sideways movement is observed, it is possible to trade inside the channel. It implies opening short and long positions when the chart bounces from the channel boundaries.
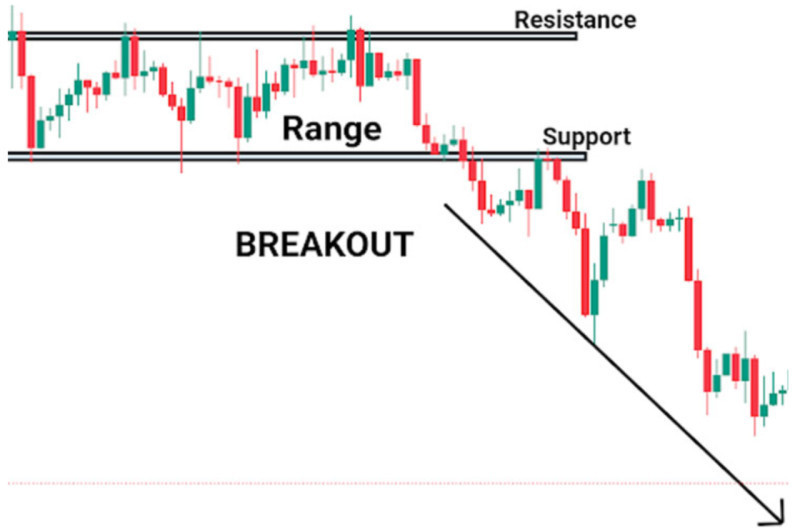
Within the framework of such price movement, it is possible to consider variants of opening trades on the breakout of the channel boundaries. In this case, the position is opened in the direction of the breakout.
However, trading on the breakout can be very risky. Since there is a considerable probability that it will be false and the cost will again continue to move within the channel.
In order to avoid such mistakes, it is better to supplement support and resistance with other instruments. For example, candlesticks and chart patterns work well with them. We will talk about them a little later.
How resistance becomes support and vice versa
As mentioned above, support and resistance can remain unchanged for quite a long time. However, there comes a moment when the value chart does break one of the boundaries and often level retest.
Let's take a closer look at how it happens and what changes it leads to. So, when the cost breaks through one of the lines, it indicates that buyers or sellers do get an advantage.
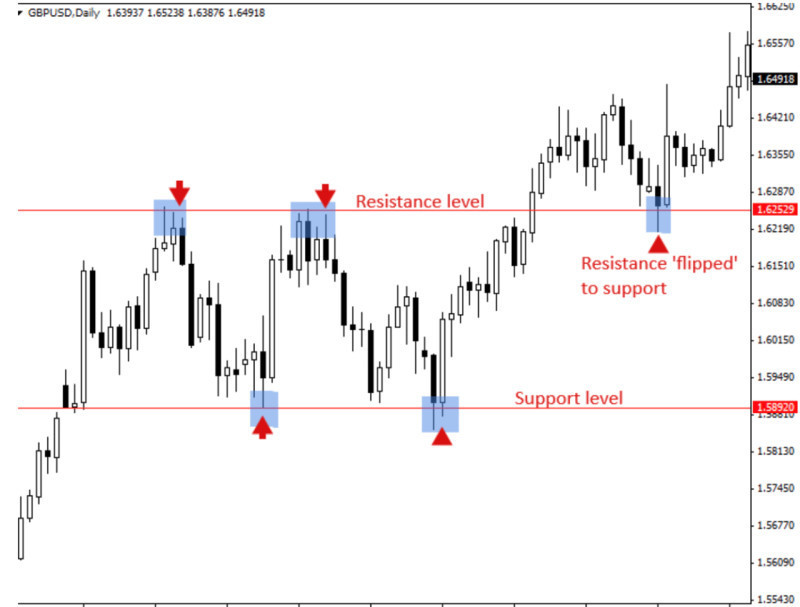
In a situation when the price crosses the upper limit and continues its upward movement, the resistance level is transformed into new support.
When the price crosses the lower limit and continues to move down, the former support level becomes a new resistance level.
It is often at this point that many traders open short or long positions in order to make the most profitable trade. However, such an entry into the trade is considered quite aggressive, as the breakdown may turn out to be false and the cost will start moving in the opposite direction.
In such a situation, a trader who opened a trade in the direction of the breakout will incur losses. To avoid this, you can follow a more conservative strategy.
This involves opening a position only after the chart tests the level that has just been broken. This means that after the breakout, the price will briefly return to the level, but will push back from it and continue to move in the direction of the breakout with even greater force.
How to check entry points
Every trader wants to make the most profitable trades, so many users are in a hurry. This, in turn, often leads to making trades at the moment when the level is wrongly broken.
To avoid this, it is necessary to check the correctness of the entry point with the help of other tools. Many traders believe that the chart already contains all the necessary information.
These users use price action, i.e. the movement of the price chart itself, to get signals about the further behavior of the price. One of the most popular tactics of this strategy is the search for candlestick patterns on the chart.
The formation of certain types of Japanese candlesticks, as well as their combinations on the chart, can indicate an imminent price reversal. Knowing the different types of candlesticks and their combinations can give a trader quite serious advantages.
It is possible and even necessary to combine several methods of market analysis. In this case, we consider the joint application of support and resistance levels and price action.
Thus, the following arrangement of candlesticks can be used as a confirmation of the breakout from the resistance level chart:
1. The open price is below the resistance, while the close price is above it;
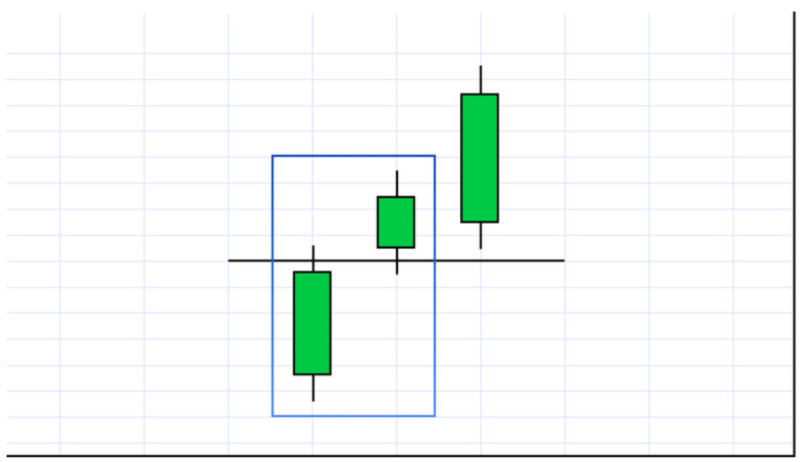
2. The previous candlestick is located below the level, and the body of the next candlestick is fully formed above the resistance level, i.e. there is a certain gap in the price between these two candlesticks;
3. The price retests the resistance line, which has already become a new support, after which the chart bounces upwards and continues its upward movement;
4. There is a steady growth during several consecutive candlesticks, each of which closes higher than the previous one.
Trading with indicators
In addition to candlestick patterns, other tools can be used to confirm the signals that a trader can get by overlaying support and resistance on the chart. For example, technical indicators, one of which is the MT4 Murray levels.
Many traders find it too complicated compared to other tools and do not use it. Although this indicator can significantly increase the effectiveness of a trader's trading strategy.
This tool can simultaneously determine both the strength of the current trend and potential reversal points. When using this indicator, 12 horizontal lines are drawn on the chart, but 8 of them are the main ones.
Each level has its own purpose, for example, the 0th and the 8th are resistance levels, between the 3rd and the 5th there is a sideways movement, and so on. If this tool seems too complicated, you can use other indicators.
One of the most commonly used tools to confirm a breakout is the volume indicator. The chart of this tool is displayed in a separate window in the form of a histogram.
The bars of the histogram reflect the total number of trades made per unit of time, i.e. one candle on the chart. By default, the charts of the main instrument for trading levels and the volume indicator have the same time frame.
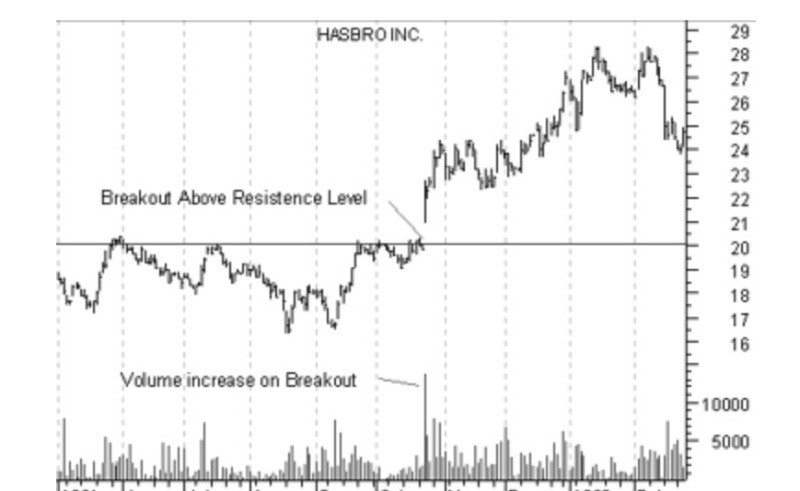
During a powerful price movement, trading volumes start to increase sharply. This is proof of a true breakout, as during periods of consolidation trading volumes are at a low level. Increased volumes can be an additional signal for a trader.
Pros and cons of trading with levels
Like any trading algorithm, trading with levels has its positive and negative sides. We will consider them in more detail in this section. So, the advantages of this trading algorithm include:
- Versatility. This strategy can be used on any time frames and for trading any assets;
- Simplicity in use. Drawing levels on the chart is a basic skill that every trader should master before trading;
- Objectivity. Drawing support and resistance is one of the most objective analytical tools, which gives the most comprehensive view of the market situation;
- Low risks and consistently high-profit potential. This system has been used for more than a dozen years and has proved itself very well during this time;
- Acquisition of experience and skills. When trading on a breakout, traders have to learn to use protective orders to minimize their losses if the cost suddenly changes its direction.
At the same time, the trading algorithm under consideration also has its disadvantages:
- Long waiting period. Often users have to wait for quite a long time for a signal to form first, and then for the moment to close a position;
- Lack of self-sufficiency. The levels themselves cannot give a trader enough information to open and close positions. As a rule, it is necessary to confirm signals with the help of other tools: technical indicators or candlesticks and graphic patterns;
- Difficulties with opening trades. In the case of aggressive tactics there is a risk to get a loss, in the case of a conservative approach - missing a part of potential profit;
- The necessity to act "according to the situation". The user has to independently determine the strength and reliability of levels, as well as the points of entry into a position. However, this disadvantage can be minimized by using additional tools.
Rules of trading with levels
In order for any trading strategy to be effective and profitable, it is necessary to use it correctly. We have tried to collect the most important rules of trading from levels for you in this section.
1. Remember that support and resistance levels are only applied horizontally on the chart. All other variants of support and resistance are called lines.
2. When drawing a level, you should try to ensure the greatest number of touches of the chart curve to this line. The more touches, the higher the reliability of the drawn line.
3. To get more precise boundaries, it is better to choose higher time frames - ideally from the daily time frame and higher. Support and resistance levels can also be used at lower time frames, but they will have to be moved more often as the price may cross them more quickly.
4. Use additional tools. Tools that allow you to calculate the center line from which other lines are drawn, tools to find extremes on the chart, and others are used to draw levels.
5. Choose the optimal strategy: trade in periods of directional movement or in periods of sideways movement of the value. In periods of a clearly defined trend, trades are opened when one of the boundaries is approached.
6. In intra-channel trading, you can open a large number of short-term trades every time the chart touches one of the boundaries. Another variant of the strategy is trading on the breakout of the corridor, i.e. making trades in the direction of the breakout of one of the boundaries.
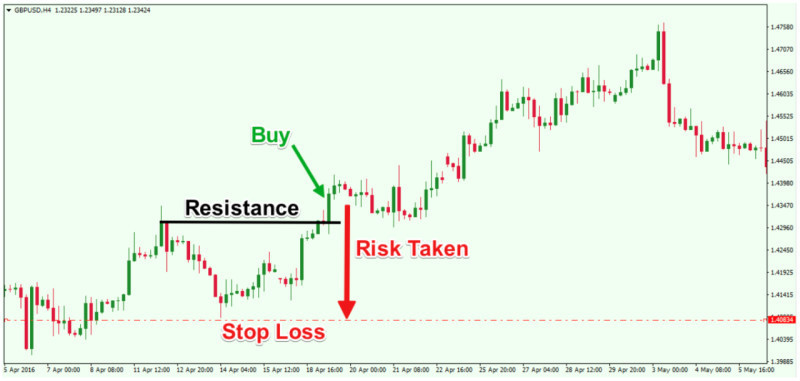
7. Whatever trading tactic you choose, be sure to use protection orders. It is quite difficult to guarantee that the price will continue to move in the same direction and not make a reversal. Protective orders help to minimize losses.
8. Use additional tools to confirm signals to enter a position. Traders usually use volume indicators and combinations of Japanese candlesticks.
Conclusion
In this article, we have considered the main points of support and resistance. These levels, along with the ability to build them, are important for every trader, regardless of what assets and time frames are used.
On the one hand, this tool is quite easy to use and is part of the essential skills that all traders should have without exception. At the same time, there are many nuances that need to be taken into account.
Trading levels always requires additional tools. However, as they can reflect a certain general picture that is being formed in the market, the process of finding entry points to a position using them can be quite complicated.
The main tactics that are used are bounce trading or breakout trading. In the first case, a trade is opened in the direction of the bounce from the boundary, and in the second case - in the direction of the breakout.
However, no one can guarantee that the price will not reverse or that the breakout will not be false, so it is recommended to place protective orders. They will help to reduce potential losses.


 Back to articles

