Hi dear colleagues! EUR/USD has been extending a downward channel since August 6 with 1.1853 as the key support. GBP/USD has been sending signals of bearish momentum since August 6 with the key support at 1.3108. USD/CHF has been following an upward channel since August 5 with the key support at 0.9117, 0.9200 is likely to be broken soon. USD/JPY is due to extend the upward bias after 106.20 is broken, 104.92 is seen as the key support. EUR/JPY is expected to climb higher after 125.11 is broken, 124.24 is the key support. GBP/JPY is due to rally after 138.95 is breached, 137.73 is the key support.
Fractal analysis for August 10, 2020
The analytical analysis of popular currency pairs is presented in terms of a 1-hour chart.
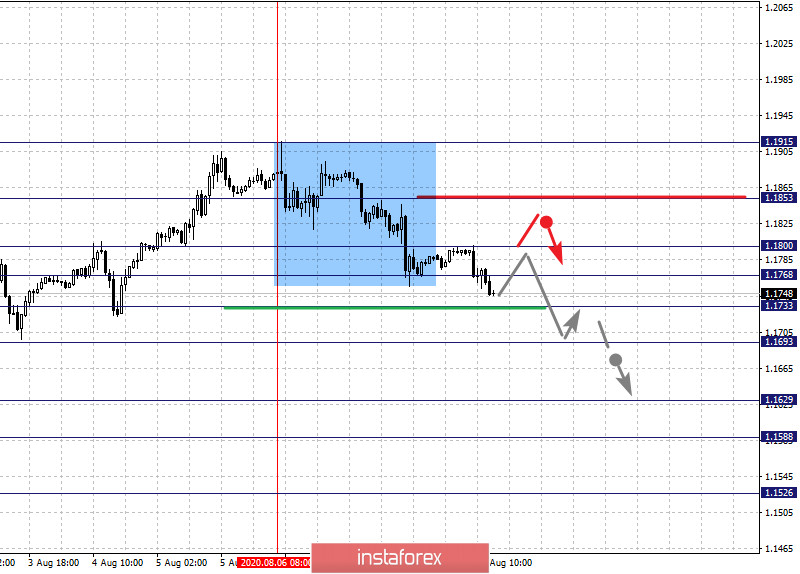
According to the 1-hour chart, EUR/USD has the following key levels: 1.1915, 1.1853, 1.1800, 1.1768, 1.1733, 1.1693, 1.1629, 1.1588, and 1.1526. The price gained upward momentum on August 6. Now the pair is making a short-term downward correction in the corridor of 1.1733 – 1.1693 with the target of 1.1629. I expect a consolidation inside the corridor of 1.1629 – 1.1588. The ultimate downward target is 1.1526. Once it is reached, I expect an upward retracement.
The short-term downward correction is possible inside the corridor of 1.1768 – 1.1800. If is it broken downwards, the pair is due to make a deeper correction with the downward target of 1.1853 which is seen as the key support for the bearish structure from August 6.
The overall bias is bearish in line with the downward structure from August 6
Trading tips
Buy: 1.1768 Take profit: 1.1800
Buy: 1.1804 Take profit: 1.1850
Sell: 1.1733 Take profit: 1.1700
Sell: 1.1690 Take profit: 1.1630
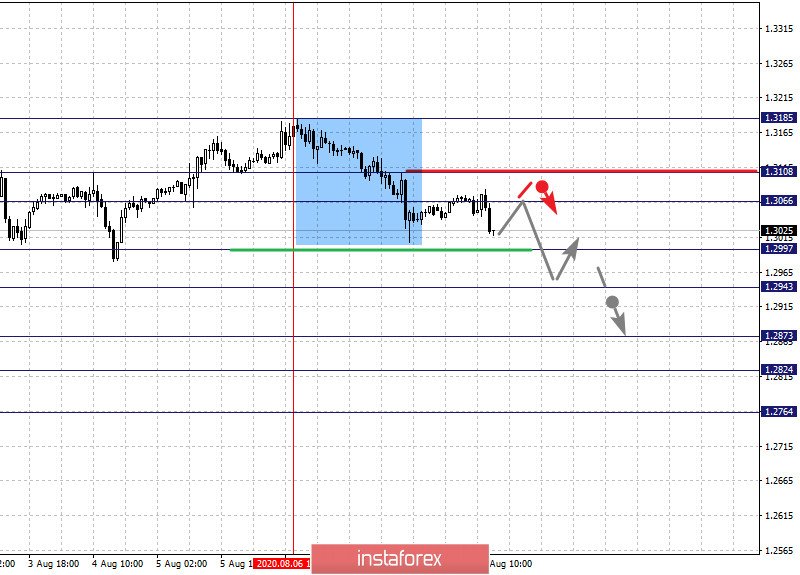
Under the 1-hour timeframe, GBP/USD has the following key levels: 1.3185, 1.3108, 1.3066, 1.2997, 1.2943, 1.2873, 1.2824, and 1.2764. It would be a good idea to monitor the downward channel formed on August 6. I predict the short-term downward move inside the corridor of 1.2997 – 1.2943. In case the lower border is breached, the clear-cut downward move will follow with the target at 1.2873. The brief move inside the corridor of 1.2873 – 1.2824 will be followed by consolidation. The ultimate downward target is seen as 1.2764. Once it is reached, the price will rebound.
Another possibility is a short-term upward move in the trading range of 1.3066 – 1.3108. If the upper border is broken, the next step will be the upward structure with the target level at 1.3185.
The overall bias is the downward move which began on August 6.
Trading tips:
Buy: 1.3066 Take profit: 1.3106
Buy: 1.3110 Take profit: 1.3185
Sell: 1.2997 Take profit: 1.2945
Sell: 1.2940 Take profit: 1.2873
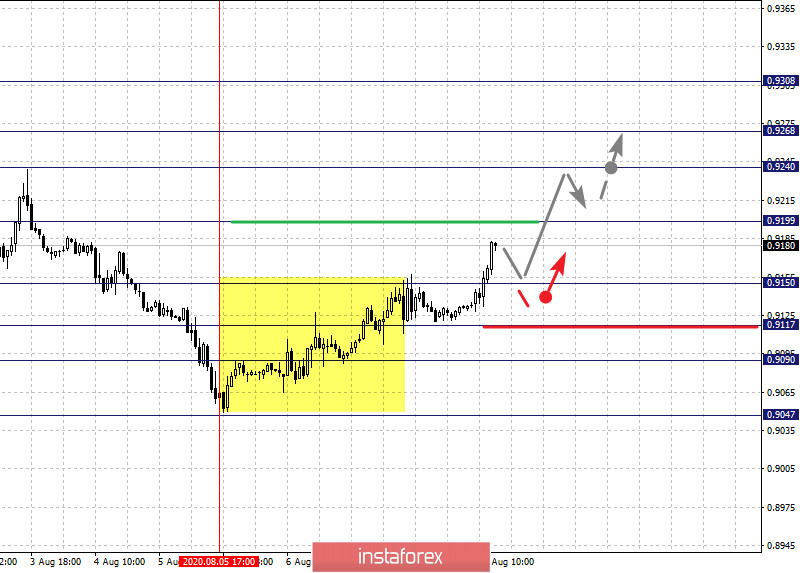
On the basis of the H1-hour chart, USD/CHF has the following key levels: 0.9308, 0.9268, 0.9240, 0.9199, 0.9150, 0.9117, 0.9090, and 0.9047. My recommendation is to monitor the upward structure formed on August 5. It makes sense to expect the upward move after a breakout of 0.9200 with the target at 0.9140. In this case, the price is moving inside the corridor of 0.9240 – 0.9268 for a short term with consolidation to follow. The upward target is set at 0.9308. Once it is over, I expect a correction which will be followed by a downward retracement.
On the other hand, a brief downward move could happen in the corridor of 0.9150 – 0.9117. If the lower border is broken, a deeper correction will follow with the target at 0.9090. This level is viewed as the ley support for the upward correction.
The overall trend is the bullish move which began on August 5.
Trading tips:
Buy: 0.9200 Take profit: 0.9240
Buy: 0.9243 Take profit: 0.9265
Sell: 0.9150 Take profit: 0.9120
Sell: 0.9116 Take profit: 0.9090
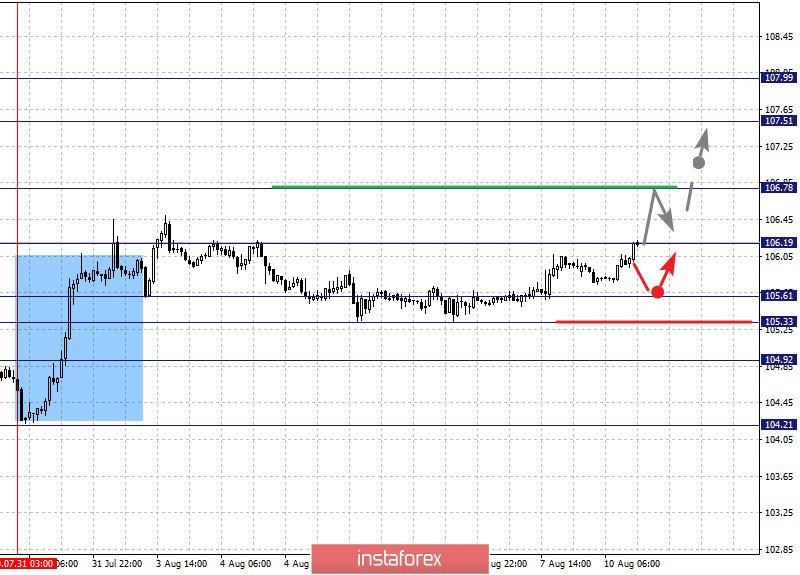
Let's consider the key levels for USD/JPY: 107.99, 107.51, 106.78, 106.19, 105.61, 105.33, 104.91, and 104.21. The price has been forming the bullish momentum since July 31. Once the level of 106.19 is broken, the price will continue with the upward move with the target at 106.78. Here the consolidation is expected. The breakout of 106.80 will confirm the clear upward move with the target of 107.51. The ultimate upper level is seen at 107.99. When it is hit, I assume a consolidation which will be followed by a downward retracement.
The alternative scenario is the consolidation within the corridor of 105.61 – 105.33. If the lower border is broken, a deeper correction will follow with the target at 104.91. When this level is reached, the price will consolidate. If this level is broken, the upward structure from July 31 will be cancelled.
The overall trend is the bullish move which began on July 31.
Trading tips:
Buy: 106.20 Take profit: 106.74
Buy: 106.80 Take profit: 107.50
Sell: 105.30 Take profit: 104.94
Sell: 104.90 Take profit: 104.25
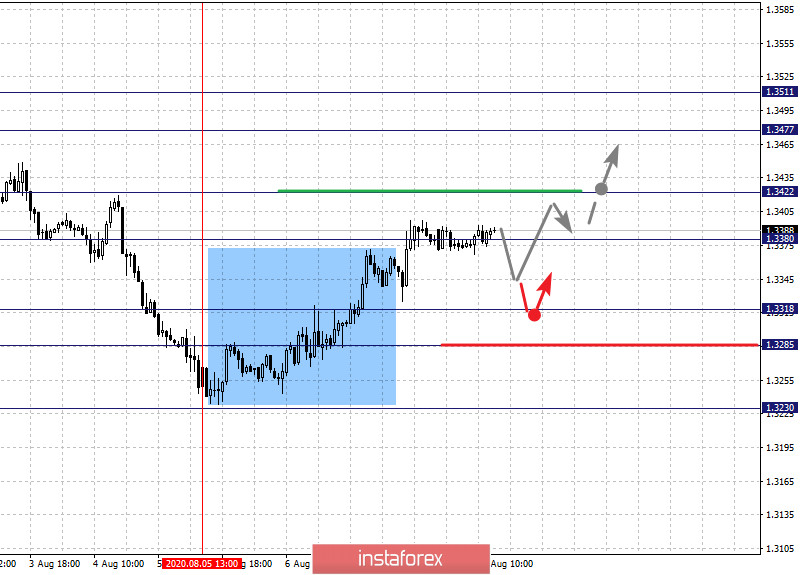
When it comes for USD/CAD, the most important levels here are 1.3511, 1.3477, 1.3422, 1.3380, 1.3318, 1.3285, and 1.3230. The pair has been forming the bullish momentum since August 5. I expect a further upward move after 1.3380 is broken with the target at 1.3422 which will be followed by consolidation. Then, a breakout of 1.3424 will confirm a clear-cut uptrend with the target of 1.3477. The ultimate upward level is seen at 1.3511. Once it is hit, I predict consolidation which will be followed by a downward retracement.
A brief downward move is possible inside the corridor of 1.3318 – 1.3285 from where the odds are in favor of the upward reversal. If 1.3285 is breached, this will create the conditions for the local downward correction with the target at 1.3230.
The overall trend is a downward cycle which began on July 30. The pair is at a stage of a deep downward correction.
Trading tips:
Buy: 1.3380 Take profit: 1.3420
Buy: 1.3424 Take profit: 1.3475
Sell: 1.3318 Take profit: 1.3287
Sell: 1.3283 Take profit: 1.3235
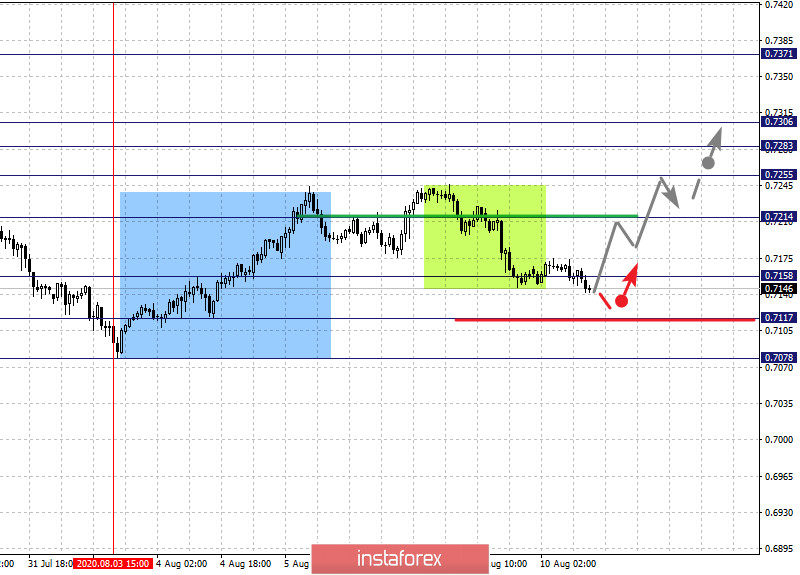
Let's consider the key levels of AUD/USD according to the 1-hour chart: 0.7371, 0.7306. 0.7283, 0.7255, 0.7214, 0.7158, 0.7117, and 0.7078. The currency pair has been forming the bullish momentum since August 3. After 0.7114 is broken, the price will extend the upward move with the first target at 0.7255. If broken, the price will continue its climb towards 0.7283 with consolidation to follow. One the price exits the corridor of 0.7283 – 0.7306, this will reinforce the upward move with the target of 0.7371.
The brief downward move is possible in the corridor of 0.7158 – 0.7117. If broken, the bullish scenario will be cancelled with the target of 0.7078.
The overall trend is the bullish scenario which began on August 3. The pair is at a stage of a deep correction.
Trading tips:
Buy: 0.7215 Take profit: 0.7255
Buy: 0.7257 Take profit: 0.7283
Sell: 0.7156 Take profit: 0.7120
Sell: 0.7115 Take profit: 0.7078
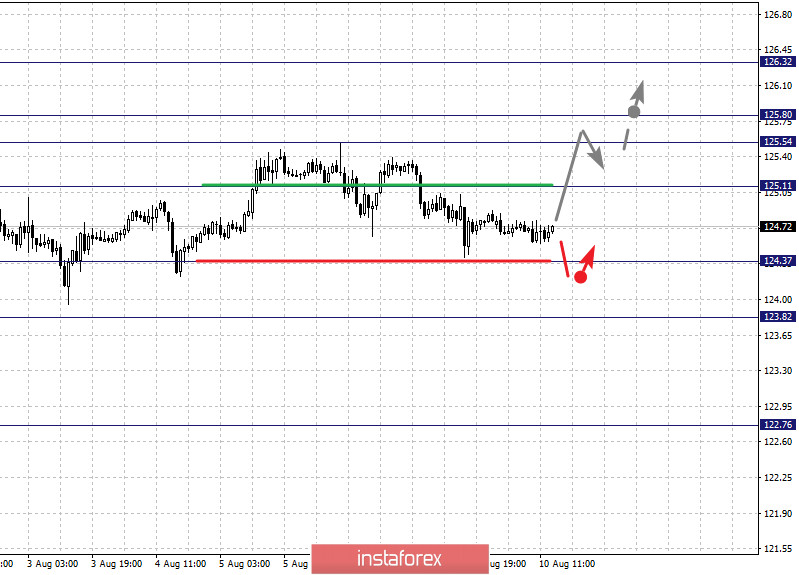
The key levels for EUR/JPY are the following: 126.32, 125.80, 125.54, 125.11, 124.81, 124.37, and 123.82. Please be aware of the upward move which has been forming since July 24. At present, the currency pair is at a correction stage. If 125.11 is broken, the first target level is placed at 125.54. The brief downward move is expected in the trading range of 125.54 – 125.80. If it is broken, the price will move downward with the target at 126.32. When it is hit, I expect a downward retracement.
124.37 is the key support. If it is breached, the conditions will favor a formation of the downward structure with the target of 123.82. Until then, I expect early signs of the downward cycle.
The overall trend is the upward structure which began on July 24. The pair is at a stage of a deep correction.
Trading tips:
Buy: 125.11 Take profit: 125.50
Buy: 125.55 Take profit: 125.80
Sell: 124.35 Take profit: 123.90
Sell: Take profit:
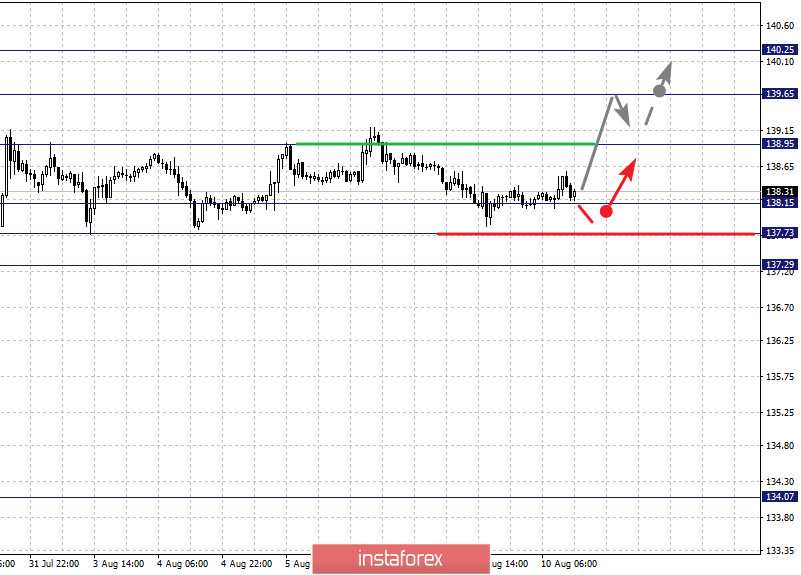
Eventually, the key levels of GBP/JPY are the following: 140.25, 139.65, 138.95, 138.15, 137.73, and 137.29. It makes sense to monitor the upward structure which began on July 17. If 138.95 is breached, the price will continue its climb with the target at 139.65 which will be followed by consolidation. The potential upward target is seen at 140.25. Once it is broken, the price is due to consolidate which will be followed by a downward retracement.
A brief downward move is possible in the corridor of 138.15 – 137.73. Its breakout will trigger a deeper correction with the target at 137.29 which will serve as the key support.
The overall trend is the upward structure which began on July 17.
Trading tips:
Buy: 138.95 Take profit: 139.60
Buy: 139.70 Take profit: 140.25
Sell: 138.15 Take profit: 137.80
Sell: 137.70 Take profit: 137.30