From a comprehensive analysis, we see a flat formation that has come to a successful conclusion. Now about the details. More than 100 hours, or four trading days, it took so much time for the 1.2280//1.2380//1.2480 flat to be formed on the market, during which not only compression against the past week was revealed, but also a local slowdown in volatility. The phenomenon is extremely interesting, and if we make a comparison with a similar period of time, but for the EUR/USD currency pair, then we will see a lack of correlation, as well as a discrepancy in the activity. In other words, there was no activation of the dollar in this case, and many are inclined to believe that this is a kind of deferred move and we are still waiting ahead, but on a more impressive scale. We can agree with this judgment since, in comparison with the euro/dollar, the pound bounced from historical lows not by 500 points, but by the entire 1000 points. That is, we have a reserve of trading forces, as well as potential activity, and the existing slowdown (flat) can be a catalyst for trading forces.
Regarding trading approaches, we remain followers of the method of local operations, since with such activity and the external background, the trend does not make much sense.
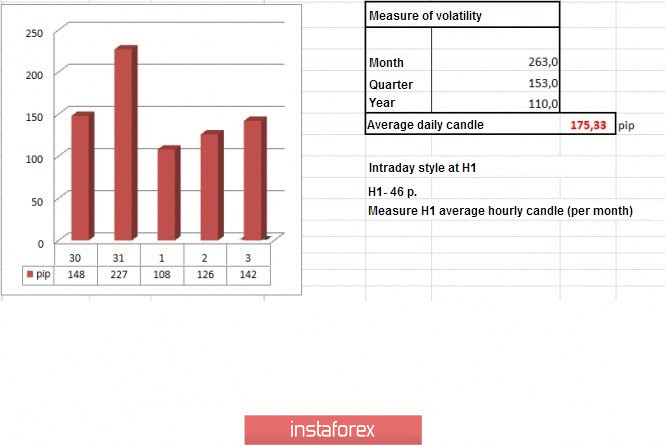
In terms of volatility, we see that for the second day in a row, there was a slowdown relative to the daily average, and this is one of the best signals, paired with a flat for further acceleration.
Details of volatility: Monday-165 points; Tuesday-245 points; Wednesday-172 points; Thursday-358 points; Friday-359 points; Monday-144 points; Tuesday-271 points; Wednesday-676 points; Thursday-354 points; Friday-522 points; Monday-267 points; Tuesday-296 points; Wednesday-333 points; Thursday-452 points; Friday-352 points; Monday-148 points; Tuesday-227 points; Wednesday-108 points; Thursday-126 points. The average daily indicator, relative to the dynamics of volatility is 175 points (see the table of volatility at the end of the article).
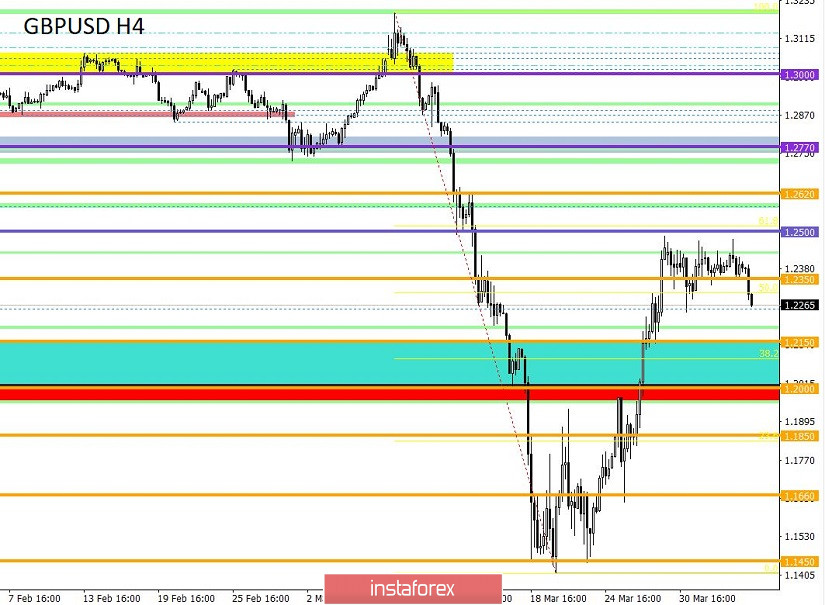
As discussed in the previous review, traders considered the boundaries of 1.2280/1.2480 (1.2500) as the main positions in case of a breakout.
The recommendation from Thursday partially coincided, having a small, but still profitable, we are waiting for further success.
(We consider selling positions if the price is fixed below 1.2280 with the prospect of a move to 1.2245-1.2200. The second option considers working within the range, where the sell positions are located in the area of 1.2430, with a move towards 1.2350.)
Looking at the trading chart in general terms (the daily period), we see a local slowdown in the inertia of the past week, that is, there were no changes for four trading days, and traders saw conditional doji candles.
The news background of the past day had data on the labor market in the United States, where the number of applications for unemployment benefits again shocked market participants. So, the number of initial applications was 6,648,000 and repeated - 3,029,000, and these are echoes of the great depression, which experts like to compare so much. The market reaction to such stunning data was beyond the logic of fundamental analysis, the US dollar did not lose its position, but, on the contrary, began to strengthen, what is the reason? There is a theory that investors choose the lesser of two evils, that is, the data for the States is terrible due to the consequences of the COVID-19 virus, but the consequences will affect not only the United States, but also other countries, where the outcome may be even worse. Investors remain confused in the currency that is more stable, i.e. the US dollar.
In terms of the general information background, we see the strongest impact on the world economy due to the actively spreading coronavirus, where more than one million cases of infection have already been recorded. The consequences are still ahead of us, but already countries are counting the damage from the virus, and investors are trying to save what they have.
Today, in terms of the economic calendar, we have a report from the United States Department of Labor, where everything is expected to decline, but it may turn out to be even worse. From the preliminary estimate, unemployment is expected to increase from 3.5% to 4.0%, and the number of jobs outside of agriculture may decrease by 150 thousand.
Once again, the consequences of the COVID-19 virus will affect all countries, which means that investors are not looking at one point.
The upcoming trading week in terms of the economic calendar is not particularly full of statistical indicators, but this is not necessary when we have such an impressive external background, which creates enormous pressure on market participants. Among the most notable statistics are applications for unemployment benefits with staggering indicators, as well as inflation.
The most interesting events are displayed below:
On Tuesday, April 7
US 15:00 London time - number of open vacancies in the labor market JOLTS (Feb)
On Wednesday, April 8
US 19:00 London time - minutes of the meeting of the Federal Open Market Committee of the US Federal Reserve
On Thursday, April 9
UK 07:00 London time - industrial production (Feb)
US 13:30 London time - applications for unemployment benefits
On Friday, April 10
US/EU/Britain - Good Friday
US 13:30 London time - inflation
Further development
Analyzing the current trading chart, we see that during the start of the European session, a round of descending positions appeared, which managed to put pressure on the lower border of the flat 1.2280//1.2380//1.2480. In fact, a breakout is already visible on the hourly periods (H1), but there are no fixations yet. The signal is good, but it is better to wait for a little and focus on the minimum of March 31 - 1.1244. We should not forget that the flat took place for more than 100 hours, and the slowdown in it signaled a clear accumulation, thus we will still be able to participate in the rally.
In terms of the emotional background, we see a characteristic caution, but also panic among market participants, which is used by speculators.
In turn, traders are particularly attentive to the behavior of the external background, as the report of the United States Department of Labor may put pressure on the dollar, but in this case, we should wait for a little and move to a shorter time period, where long positions may occur in the run-up to the announcement of the data.
Based on the above information, we will output trading recommendations:
- Buy positions are considered higher than 1.2300 with the prospect of a move to 1.2350. Closer to the report, you should switch to minute intervals, where the most attractive entry levels may appear. If the report will have any major impact on the dollar, in terms of attenuation, we examine the return rates in the source frame flat.
- We consider selling positions if the price is fixed below 1.2240 with the prospect of a move to 1.2150-1.2000.
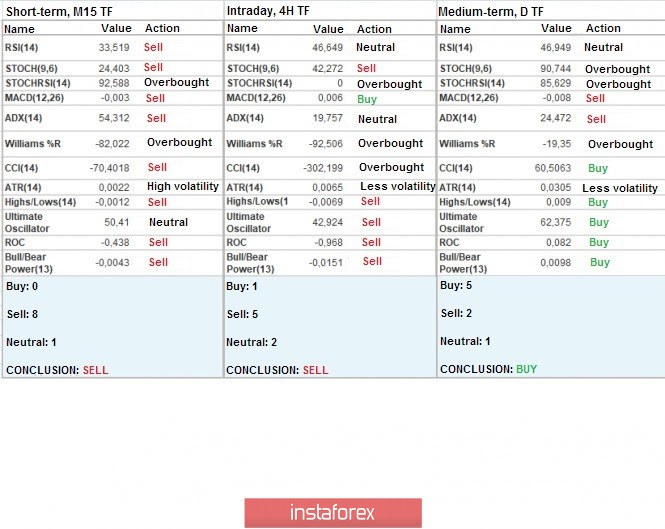
Indicator analysis
Analyzing different sectors of timeframes (TF), we see that the indicators of technical instruments began to gradually give out a sell signal, but the daily period still retains an upward interest, reflecting the past week.
Volatility per week / Measurement of volatility: Month; Quarter; Year.
Volatility measurement reflects the average daily fluctuation, calculated for the Month / Quarter / Year.
(April 3 was based on the time of publication of the article)
The volatility of the current time is 142 points, which is even less than the daily average, but in the case of a breakdown of the flat borders, we can see an acceleration. It is worth considering that the external background, as well as the report of the United States Department of Labor, may have a direct role in the upcoming acceleration of volatility.
Key levels
Resistance zones: 1.2350**; 1.2500; 1.2620; 1.2725*; 1.2770**; 1.2885*; 1.3000; 1.3170**; 1.3300**; 1.3600; 1.3850; 1.4000***; 1.4350**.
Support zones: 1.2280 (1.2240); 1.2150**; 1.2000*** (1.1957); 1.1850; 1.1660; 1.1450 (1.1411); 1.1300; 1.1000; 1.0800; 1.0500; 1.0000.
* Periodic level
* * Range level
*** Psychological level
**** The article is based on the principle of conducting a transaction, with daily adjustments.