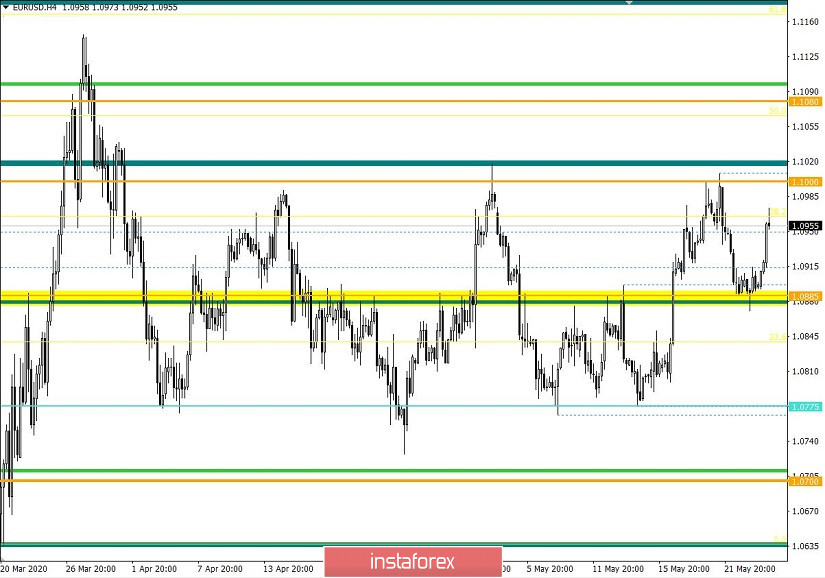
From the point of view of complex analysis, we can see the acceleration that occurred yesterday within the sideways channel.
The dynamics of yesterday's trading day was quite low, with the quotes continuing to fluctuate within the average deviation of the flat 1.0775 // 1.0885 // 1.1000, practicing it as support and thereby stopping any downward movement from the upper border. Activity was low throughout the market, with which the GBP / USD pair also recorded a volatility of only 39 points. The lack of important news yesterday, as well as the day off in the US and the UK, served as a deterrent factor, which led to a decrease in trade volumes. The bright stop within the average deviation level attracted the special attention of speculators, which is indicated by the current charts.
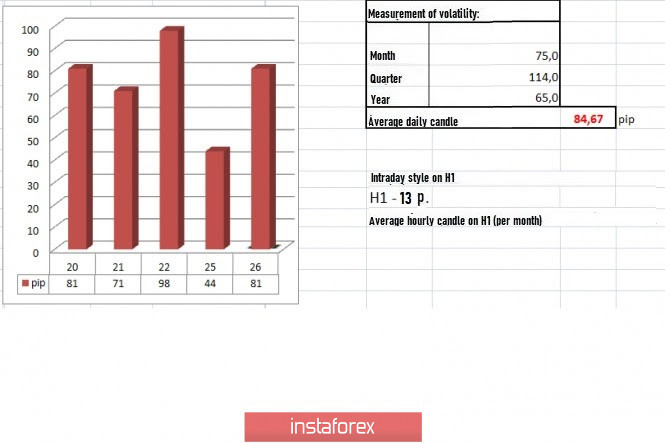
Looking at the dynamics of volatility separately, we can see that the series of accelerations took a short pause of 44 points, the lowest figure recorded for 31 trading days, which revealed why speculators became so excited when they saw so many successful, comparable factors for their current positions.
As discussed in the previous review, traders worked on a downward move from the upper border of the flat, the result of which pushed the quotes to the value of 1.0885. Further decline will certainly occur while the quotes are within the flat, but local operations were not forgotten, so the level of 1.0920 was taken into account in case of a local rebound from the 1.0885 area.
Analyzing the daily chart, we can see that the sequence of fluctuations within the flat indicates a one big downward trend.
The news published yesterday contained the final data on Germany's 1st quarter GDP, the value of which coincided with economists forecast, recording a decline of -2.3%. However, market reaction was practically non-existent, since the people already expected such figures.
With regards to the coronavirus, attempts of easing restrictive measures continue, with Hong Kong opposing the Beijing National Security Law.
Meanwhile, data on the real estate market in the US will be published today, with the S & P / CS composite housing cost index expecting a decrease from 3.5% to 3.0%. New homes sales also expect a -21% drop in the index. If the forecasts turn out to be true, the dollar is sure to decrease value.
Further development
Analyzing the current trading chart, we can see a sharp surge in the activity of long positions from the area of the average deviation of the flat formation. The slowdown yesterday played a huge role in the market, where speculators took advantage of the situation and formed fluctuations. A similar development is present on almost all trading instruments [Forex], so we can conclude that the US dollar has fallen under sell-offs.
Although the flat within 1.0775 // 1.0885 // 1.1000 seems to have lost its strength, the quotes are still within its boundaries, so a rebound in the opposite direction is still possible.
Looking at the current dynamics, we can assume that the speculative mood is still present in the local market. Although there is no clear signal of a breakout of the 1.1000 border, consider the possibility of a rebound in the opposite direction, with the quotes returning to a deviation of 1.0885. The main development today is still downwards, but be prepared for any movement, such as upwards, especially if radical changes occur in the trading chart.
Based on the above information, we derived these trading recommendations:
-Consider selling positions lower than 1.0940, towards 1.0900 / 1.0885.
- Open buy positions from the value 1.0920, with prospects of a movement to 1.0950. Wait for a consolidation and observe the dynamics.
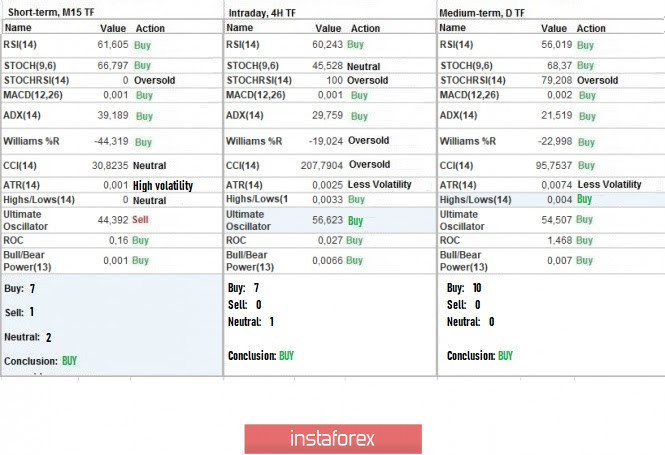
Indicator analysis
Analyzing the different sectors of timeframes (TF), we can see that the indicators of the hourly and daily periods signal purchases, which reflects the movement of quotes in the upper border of the sideways channel.
Volatility per week / Measurement of volatility: Month; Quarter Year
The measurement of volatility reflects the average daily fluctuation calculated by Month / Quarter / Year.
(May 26 was built, taking into account the time of publication of the article)
Volatility is currently 81 points, which is almost twice of yesterday's dynamics. If quotes continue to trade inside the flat, a slowdown may occur, and the dynamics of the rest of the day will be conducted within the channel.
Key levels
Resistance zones: 1,1000 ***; 1.1080 **; 1,1180; 1.1300; 1.1440; 1.1550; 1.1650 *; 1.1720 **; 1.1850 **; 1,2100
Support areas: 1.0850 **; 1.0775 *; 1.0650 (1.0636); 1,0500 ***; 1.0350 **; 1,0000 ***.
* Periodic level
** Range Level
*** Psychological level