empty
 
 
28.07.2022 07:31 AM
NZDUSD Potential For Bullish Continuation | 28th July 2022

This image is no longer relevant

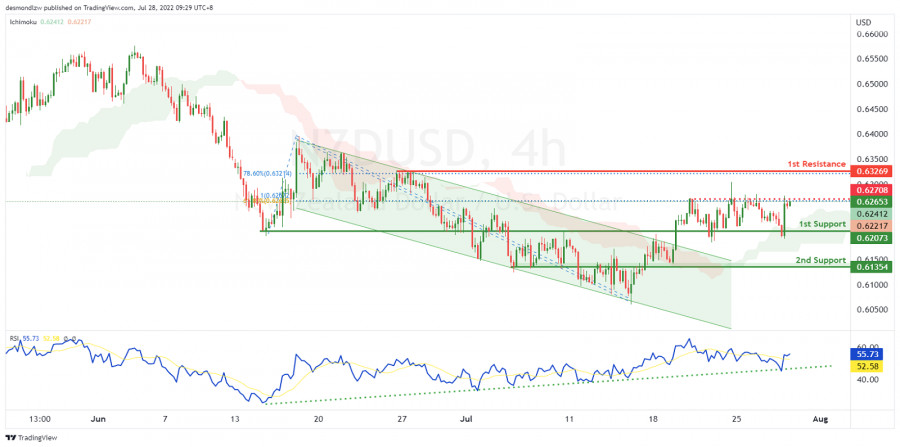
On the H4, with price breaking the descending trend channel, RSI showing an ascending trendline and moving above the ichimoku cloud, we have a bullish bias that price will rise from the 1st support at 0.62073 at the overlap support. If price breaks the intermediary resistance at 0.62708 at the swing high in line with the 61.8% fibonacci retracement and 100% fibonacci projection, we will have upside confirmation that price will rise to the 1st resistance at 0.63269 at the swing high in line with the 78.6% fibonacci retracement. Alternatively, price may break the support structure at the 1st support and drop to the 2nd support at 0.61354 at the pullback support.

Trading Recommendation

Entry: 0.62073

Reason for Entry:

Overlap supportTake Profit: 0.63269

Reason for Take Profit:Swing high in line with the 78.6% fibonacci retracement Stop Loss: 0.61354

Reason for Stop Loss:

Pullback support

Dean Leo,
Analytical expert of InstaForex
© 2007-2023
NZDUSD
New Zealand Dollar vs US Dollar
Select timeframe
5
min
15
min
30
min
1
hour
4
hours
1
day
1
week
Start trade
Start trade
USDJPY, H4 | Potential Reversal from a key level?
The USD/JPY chart maintains a bearish momentum overall, indicating that the price could potentially react negatively to the first resistance level and drop towards the first support level. The first support at 131.59 is a robust level, coinciding with an overlap support and a 38.20% Fibonacci.
Author: Dean Leo
01:52 2023-03-30 UTC--4
1675
GBPUSD, H4 | Continue to 1st Support?
The GBP/USD chart shows a bearish momentum, indicating the possibility of price continuing its decline towards the first support level. Presently, the price is testing the first resistance level at 1.2343, which is a multi-swing high resistance level. A failure to break through this resistance.
Author: Dean Leo
01:51 2023-03-30 UTC--4
1495
DXY, H4 | Strong descending trendline ?
The DXY index is currently displaying strong bearish momentum, trading below a significant descending trend line, indicating further potential for price drops. If the trend continues, the index could decline towards its first support level at 101.93, which is a multi-swing low support level and.
Author: Dean Leo
01:50 2023-03-30 UTC--4
1660
Show more
  • Grand Choice
    Contest by
    InstaForex
    InstaForex always strives to help you
    fulfill your biggest dreams.
    JOIN CONTEST
  • Chancy Deposit
    Deposit your account with $3,000 and get $8000 more!
    In March we raffle $8000 within the Chancy Deposit campaign!
    Get a chance to win by depositing $3,000 to a trading account. Having fulfilled this condition, you become a campaign participant.
    JOIN CONTEST
  • Trade Wise, Win Device
    Top up your account with at least $500, sign up for the contest, and get a chance to win mobile devices.
    JOIN CONTEST
  • 100% Bonus
    Your unique opportunity to get a 100% bonus on your deposit
    GET BONUS
  • 55% Bonus
    Apply for a 55% bonus on your every deposit
    GET BONUS
  • 30% Bonus
    Receive a 30% bonus every time you top up your account
    GET BONUS

Recommended Stories

DXY, H4 | Strong descending trendline ?

The DXY index is currently displaying strong bearish momentum, trading below a significant descending trend line, indicating further potential for price drops. If the trend continues, the index could decline

Dean Leo 07:50 2023-03-30 UTC+2

US500, H4 | Ascending trendline ?

US500 chart is bullish, with price above a major ascending trend line, potential for bullish continuation to first resistance. First support level at 3903.06 is a strong multi-swing low support

Dean Leo 08:04 2023-03-28 UTC+2

WIT(OIL), Day | Strong descending trendline ?

WTI oil prices have turned bearish as they fell below a crucial support level. The chart indicates that the momentum has shifted to the downside, signaling a potential further decline

Dean Leo 07:46 2023-03-27 UTC+2

USDJPY, H4 | Strong descending trendline ?

The USD/JPY pair currently has a weak momentum with low confidence due to its position below a major descending trend line, indicating possible bearish momentum. Breaking off from the first

Dean Leo 06:07 2023-03-24 UTC+2

USDCAD, H4 | Respected descending trendline ?

The charts indicate that the USD/CAD currency pair is currently experiencing a bearish momentum, with price situated below a significant descending trend line. As such, it is likely that

Dean Leo 06:55 2023-03-23 UTC+2

USD/JPY, H4 | Break out trendline?

The USD/JPY chart currently reflects a bullish momentum as it is trading above a significant ascending trend line, indicating potential for further bullish movement. In case the price manages

Dean Leo 06:37 2023-03-22 UTC+2

AUDUSD, H4 | Break out trendline?

Currently, the AUD/USD chart reflects bullish momentum, indicated by the break above a descending resistance line and the crossing above the Ichimoku cloud. The potential for continued bullish movement towards

Dean Leo 07:53 2023-03-21 UTC+2

EURUSD, Day | Potential reversel?

The EUR/USD pair has bullish momentum and may move towards the 1st resistance level. Pullback support at 1.0478, coinciding with the 38.20% Fibonacci retracement level, is currently supporting the price

Dean Leo 09:44 2023-03-20 UTC+2

GBPUSD, H4 | Potential reversel from trendline?

The GBP/USD chart currently exhibits bearish momentum, as the price remains below a significant descending trend line. This indicates that the currency pair may undergo further downward pressure

Dean Leo 08:05 2023-03-17 UTC+2

AUDUSD, H4 | Potential reversel from trendline?

Price is approaching our 1st resistance level at 0.6694 along with a 61.8% Fibonacci retracement. If the price were to break above, it could push up to 2nd resistance

Dean Leo 10:10 2023-03-16 UTC+2
Can't speak right now?
Ask your question in the chat.