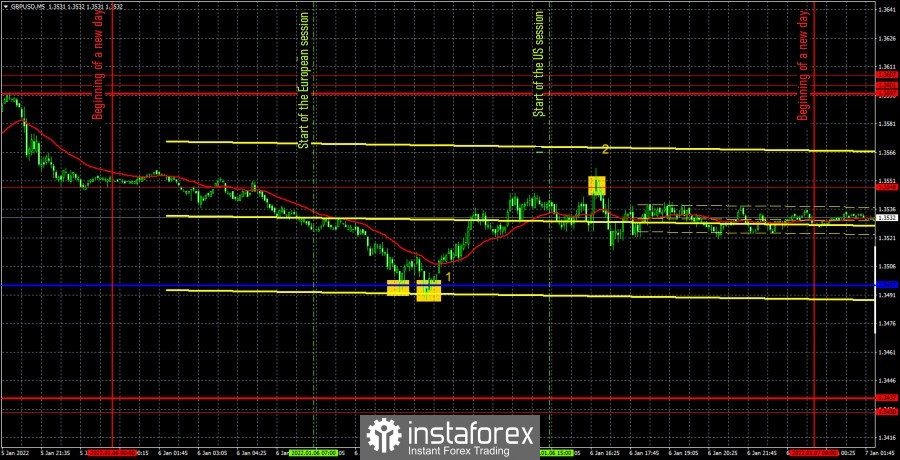
GBP/USD 5M

The GBP/USD pair moved much better than EUR/USD on Thursday. There were about the same number of macroeconomic statistics and important events. In addition to the ISM report in the US, the business activity index for the service sector was published in the UK. It showed an increase in December, which could add optimism to bulls of the British pound. As you can see, the upward movement continued after this release (the figure "1" in the chart). But traders completely ignored the ISM report because it was weaker than forecasts and was supposed to provoke a fall in the dollar, and after its release, the growth of the US currency was observed. Thus, we can only deal with all the trading signals of Thursday, of which there were very few. The first and second buy signals were formed near the critical Kijun-sen line. A rebound for both times. Traders had to open long positions either on the first signal or on the second, but not duplicate them. As a result, the pair began to grow and by the middle of the US session it rose to the extreme level of 1.3548. In total, after the formation of buy signals, the pair also went up both 40 points and 50. That is, the transaction could be closed at any Take Profit or it could be closed manually near the level of 1.3548. It was possible to open a short position at the sell signal of a rebound from the 1.3548 level, since it was not too late. However, this time the price could not continue moving in the right direction for a long time. An upward pullback began in the late afternoon, but before it began, the pair managed to go down 20 points, so a Stop Loss order had to be placed at breakeven. The transaction could be closed by this order, or it could be closed manually. In any case, at the end of the day, a profit of at least 40 points was received, with which we congratulate the traders. It should also be noted that the pound's volatility from yesterday was not too high.
We recommend you to familiarize yourself:
Overview of the EUR/USD pair. January 7. The Fed will be busy raising rates in the next two to three years.
Overview of the GBP/USD pair. January 7. The negative impact of Brexit on the UK is becoming more and more conspicuous.
Forecast and trading signals for EUR/USD for January 7. Detailed analysis of the movement of the pair and trade deals.
GBP/USD 1H
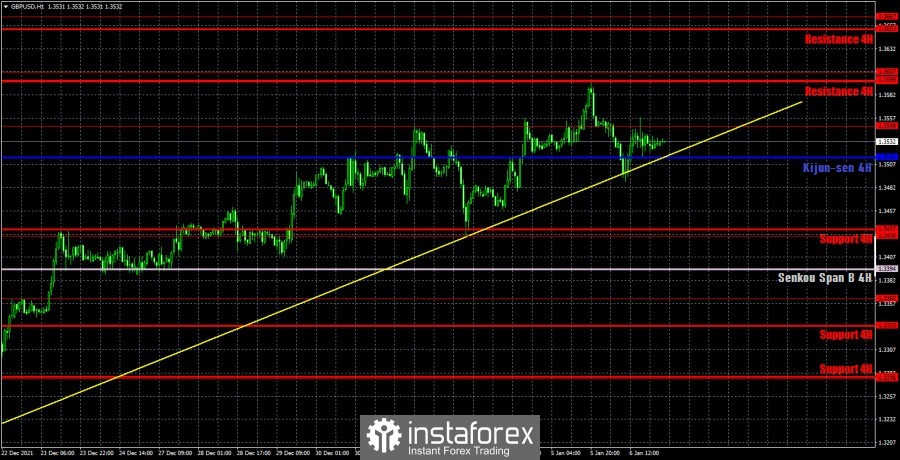
The pound/dollar pair resumed the upward trend on the hourly timeframe despite the fact that it had previously overcome the upward trend line. The rising trend line now has a new look and yesterday the pair worked it out again and bounced off it again. Thus, the upward trend is still relevant. However, a second consolidation below the trend line will significantly increase the likelihood of a new downward trend. The pound has been getting more expensive for several weeks, it's time to adjust down a bit. With the abundance of macroeconomic statistics that will be available today, the probability of this option is growing. We highlight the following important levels on January 7: 1.3430, 1.3548, 1.3598-1.3607, 1.3667. The Senkou Span B (1.3394) and Kijun-sen (1.3514) lines can also be signal sources. Signals can be "rebounds" and "breakthroughs" of these levels and lines. It is recommended to set the Stop Loss level to breakeven when the price passes in the right direction by 20 points. The lines of the Ichimoku indicator can move during the day, which should be taken into account when determining trading signals. Only the index of business activity in the construction sector is scheduled to be published in the UK on Friday. There will be many more important events in the United States. In particular, reports on the unemployment rate and Non-farms. We believe that the US reports can have a strong impact on all pairs in which the dollar is present.
Explanations for the chart:
Support and Resistance Levels are the levels that serve as targets when buying or selling the pair. You can place Take Profit near these levels.
Kijun-sen and Senkou Span B lines are lines of the Ichimoku indicator transferred to the hourly timeframe from the 4-hour one.
Support and resistance areas are areas from which the price has repeatedly rebounded off.
Yellow lines are trend lines, trend channels and any other technical patterns.
Indicator 1 on the COT charts is the size of the net position of each category of traders.
Indicator 2 on the COT charts is the size of the net position for the non-commercial group.